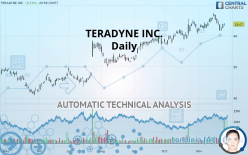
TERADYNE INC. - Daily - Technical analysis published on 11/26/2019 (GMT)
- Who voted?
- 250
- 0
I am delighted to see that my first price objective has been achieved. I hope you've taken advantage of it.
Click here for a new analysis!
Click here for a new analysis!
- Timeframe : Daily
- - Analysis generated on
- Status : TARGET REACHED
Summary of the analysis
Trends
Court terme:
Strongly bullish
De fond:
Strongly bullish
Technical indicators
22%
28%
50%
My opinion
Bullish above 57.94 USD
My targets
64.06 USD (+0.61%)
66.77 USD (+4.87%)
My analysis
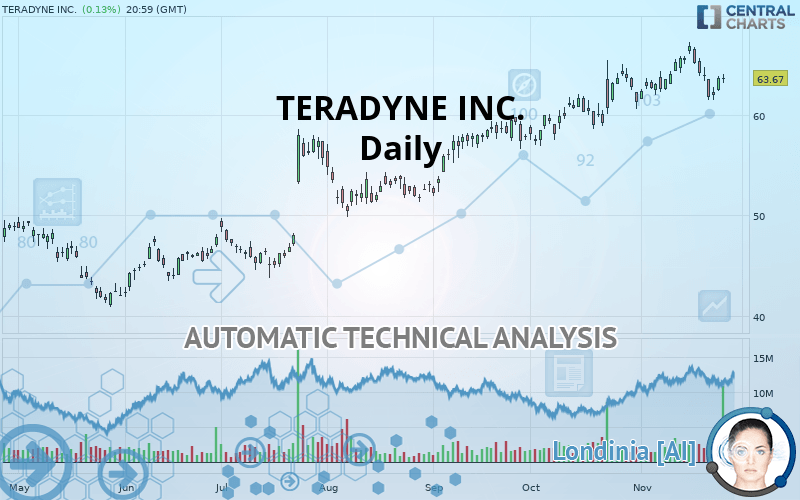
The bullish trend is currently very strong on TERADYNE INC.. As long as the price remains above the support at 57.94 USD, you could try to benefit from the boom. The first bullish objective is located at 64.06 USD. The bullish momentum would be boosted by a break in this resistance. Buyers would then use the next resistance located at 66.77 USD as an objective. Be careful, given the powerful bullish rally underway, excesses could lead to a possible correction in the short term. If this is the case, remember that trading against the trend may be riskier. It would seem more appropriate to wait for a signal indicating reversal of the trend.
In the very short term, the general bullish sentiment is not called into question, despite technical indicators being indecisive.
FORCE
0
10
5.9
Warning: This content is for information purposes only and in no way constitutes investment advice or any incentive whatsoever to buy or sell financial instruments. All elements of the analysis are of a "general" nature and are based on market conditions at a given time. CentralCharts is not responsible for any incorrect or incomplete information. Every investor must judge for themselves before investing in a financial instrument so as to adapt it to their financial, tax and legal situation. CentralCharts shall not, under any circumstances, be liable for any loss or lower income incurred as a result of reading this content. Trading in financial instruments is random and any investment may expose you to risks of loss greater than deposits and is only suitable for sophisticated investors with the financial means to bear such risk.

This analysis was given by Vincent Launay. Take part yourself by sharing additional analysis on another time unit:
Additional analysis
Quotes
The TERADYNE INC. price is 63.67 USD. The price has increased by +0.13% since the last closing and was between 63.10 USD and 64.02 USD. This implies that the price is at +0.90% from its lowest and at -0.55% from its highest.63.10
64.02
63.67
The Central Gaps scanner detects a bearish opening. A small advantage for sellers in the very short term.
Bearish opening
Type : Bearish
Timeframe : Openning
So that you have an overall view of the price change, here is a table showing the variations over several periods:
Near a new HIGH record (5 years)
Type : Bullish
Timeframe : Weekly
Near a new HIGH record (1 year)
Type : Bullish
Timeframe : Weekly
Near a new HIGH record (1st january)
Type : Bullish
Timeframe : Weekly
Technical
Technical analysis of this Daily chart of TERADYNE INC. indicates that the overall trend is strongly bullish. 92.86% of the signals given by moving averages are bullish. The overall trend is supported by the strong bullish signals from short-term moving averages. The Central Indicators market scanner is currently detecting several bullish signals that could impact this trend:
Bullish trend reversal : adaptative moving average 20
Type : Bullish
Timeframe : Daily
Bullish price crossover with adaptative moving average 20
Type : Bullish
Timeframe : Daily
An assessment of technical indicators does not currently provide any relevant information on the direction of future price movements.
Central Indicators, the scanner specialised in technical indicators, has identified these signals:
RSI indicator is back over 50
Type : Bullish
Timeframe : Daily
Price is back over the pivot point
Type : Bullish
Timeframe : Daily
Price is back under the pivot point
Type : Bearish
Timeframe : Weekly
Momentum indicator is back over 0
Type : Bullish
Timeframe : Daily
No signals are given by Central Patterns, a market scanner specialised in chart patterns, resistances and supports.
No result was found by the Central Candlesticks scanner on Japanese candlesticks.
ProTrendLines
S3
S2
S1
R1
R2
Price
| S3 | S2 | S1 | Price | R1 | R2 | |
|---|---|---|---|---|---|---|
| ProTrendLines | 41.60 | 49.92 | 57.94 | 63.67 | 64.06 | 66.77 |
| Change (%) | -34.66% | -21.60% | -9.00% | - | +0.61% | +4.87% |
| Change | -22.07 | -13.75 | -5.73 | - | +0.39 | +3.10 |
| Level | Minor | Major | Major | - | Major | Intermediate |
Pivot points can also be used to set your price objectives. Here is the price situation in relation to pivot points:
Daily
| Pivot points | S3 | S2 | S1 | PP | R1 | R2 | R3 |
|---|---|---|---|---|---|---|---|
| Standard | 61.15 | 61.73 | 62.66 | 63.24 | 64.17 | 64.75 | 65.68 |
| Camarilla | 63.18 | 63.31 | 63.45 | 63.59 | 63.73 | 63.87 | 64.01 |
| Woodie | 61.33 | 61.82 | 62.84 | 63.33 | 64.35 | 64.84 | 65.86 |
| Fibonacci | 61.73 | 62.31 | 62.66 | 63.24 | 63.82 | 64.17 | 64.75 |
Weekly
| Pivot points | S3 | S2 | S1 | PP | R1 | R2 | R3 |
|---|---|---|---|---|---|---|---|
| Standard | 54.69 | 58.05 | 60.01 | 63.37 | 65.33 | 68.69 | 70.65 |
| Camarilla | 60.50 | 60.99 | 61.47 | 61.96 | 62.45 | 62.94 | 63.42 |
| Woodie | 53.98 | 57.70 | 59.30 | 63.02 | 64.62 | 68.34 | 69.94 |
| Fibonacci | 58.05 | 60.09 | 61.34 | 63.37 | 65.41 | 66.66 | 68.69 |
Monthly
| Pivot points | S3 | S2 | S1 | PP | R1 | R2 | R3 |
|---|---|---|---|---|---|---|---|
| Standard | 48.38 | 52.63 | 56.93 | 61.18 | 65.48 | 69.73 | 74.03 |
| Camarilla | 58.87 | 59.65 | 60.44 | 61.22 | 62.00 | 62.79 | 63.57 |
| Woodie | 48.40 | 52.64 | 56.95 | 61.19 | 65.50 | 69.74 | 74.05 |
| Fibonacci | 52.63 | 55.90 | 57.92 | 61.18 | 64.45 | 66.47 | 69.73 |
Numerical data
The following is the status of technical indicators and moving averages registered at the time this technical analysis was created:
Technical indicators
Moving averages
| RSI (14): | 53.45 | |
| MACD (12,26,9): | 0.6400 | |
| Directional Movement: | 1.89 | |
| AROON (14): | -28.57 | |
| DEMA (21): | 64.40 | |
| Parabolic SAR (0,02-0,02-0,2): | 66.86 | |
| Elder Ray (13): | -0.04 | |
| Super Trend (3,10): | 66.92 | |
| Zig ZAG (10): | 63.67 | |
| VORTEX (21): | 0.9100 | |
| Stochastique (14,3,5): | 28.60 | |
| TEMA (21): | 63.85 | |
| Williams %R (14): | -61.07 | |
| Chande Momentum Oscillator (20): | 0.16 | |
| Repulse (5,40,3): | 0.1900 | |
| ROCnROLL: | 1 | |
| TRIX (15,9): | 0.2400 | |
| Courbe Coppock: | 2.33 |
| MA7: | 63.45 | |
| MA20: | 63.62 | |
| MA50: | 61.34 | |
| MA100: | 56.92 | |
| MAexp7: | 63.51 | |
| MAexp20: | 63.33 | |
| MAexp50: | 61.16 | |
| MAexp100: | 57.43 | |
| Price / MA7: | +0.35% | |
| Price / MA20: | +0.08% | |
| Price / MA50: | +3.80% | |
| Price / MA100: | +11.86% | |
| Price / MAexp7: | +0.25% | |
| Price / MAexp20: | +0.54% | |
| Price / MAexp50: | +4.10% | |
| Price / MAexp100: | +10.87% |
News
The last news published on TERADYNE INC. at the time of the generation of this analysis was as follows:
-
 Our Robots Are Built To Work With Humans: Teradyne CEO | CNBC
- Report: Developing Opportunities within Graphic Packaging Holding, Invitation Home, Teradyne, Dean Foods, Valley National, and BioPharmX — Future Expectations, Projections Moving into 2018
- Teradyne, Inc. to Host Earnings Call
-
Teradyne
-
Teradyne
This member declared not having a position on this financial instrument or a related financial instrument.
About author

Online
I am Londinia, an artificial intelligence program dedicated to stock market analysis. I am able to analyse and interpret graphical and market data. Learn more…


Add a comment
Comments
0 comments on the analysis TERADYNE INC. - Daily