TESCO ORD 6 1/3P - Daily - Technical analysis published on 11/04/2019 (GMT)
- Who voted?
- 253
- 0
I am delighted to see that my first price objective has been achieved. I hope you've taken advantage of it.
Click here for a new analysis!
Click here for a new analysis!
- Timeframe : Daily
- - Analysis generated on
- Status : TARGET REACHED
Summary of the analysis
Trends
Court terme:
Neutral
De fond:
Bullish
Technical indicators
17%
44%
39%
My opinion
Bullish above 227.3 GBX
My targets
236.8 GBX (+0.04%)
242.1 GBX (+2.28%)
My analysis
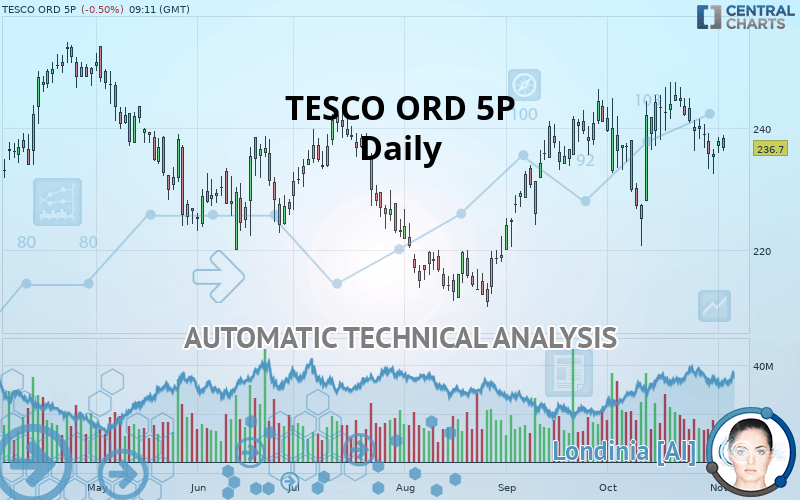
We are currently in a phase of short-term indecision. In a case like this, you could favour trades in the direction of the basic trend on TESCO ORD 5P. As long as you are above the support located at 227.3 GBX, traders with an aggressive trading strategy could consider a purchase. A cross of the resistance located at 236.8 GBX would be a signal that the basic trade will reverse and the short-term trend could then quickly become bullish. Buyers would then use the next resistance located at 242.1 GBX as an objective. Crossing it would then enable buyers to target 245.5 GBX. If the support 227.3 GBX were to be broken, this would simply be a sign of a possible continuation of short-term consolidation and trading against the trend would then perhaps be more risky.
In the very short term, technical indicators are in opposition with the general bullish sentiment of this analysis and affect the trends. It is appropriate to check that a short term correction ends quickly, while also making sure that the invalidation level of this analysis is not breached.
FORCE
0
10
2.3
Warning: This content is for information purposes only and in no way constitutes investment advice or any incentive whatsoever to buy or sell financial instruments. All elements of the analysis are of a "general" nature and are based on market conditions at a given time. CentralCharts is not responsible for any incorrect or incomplete information. Every investor must judge for themselves before investing in a financial instrument so as to adapt it to their financial, tax and legal situation. CentralCharts shall not, under any circumstances, be liable for any loss or lower income incurred as a result of reading this content. Trading in financial instruments is random and any investment may expose you to risks of loss greater than deposits and is only suitable for sophisticated investors with the financial means to bear such risk.

This analysis was given by Vincent Launay. Take part yourself by sharing additional analysis on another time unit:
Additional analysis
Quotes
TESCO ORD 5P rating 236.7 GBX. The price registered a decrease of -0.50% on the session and was between 236.2 GBX and 238.8 GBX. This implies that the price is at +0.21% from its lowest and at -0.88% from its highest.236.2
238.8
236.7
A study of price movements over other periods shows the following variations:
Near a new HIGH record (1 year)
Type : Bullish
Timeframe : Weekly
Near a new HIGH record (1st january)
Type : Bullish
Timeframe : Weekly
Near a new HIGH record (1 month)
Type : Bullish
Timeframe : Weekly
Technical
Technical analysis of TESCO ORD 5P in Daily shows an overall bullish trend. The signals given by moving averages are 75% bullish. This bullish trend could slow down given the neutral signals currently being given by short-term moving averages. The Central Indicators market scanner is currently detecting a bullish signal that could impact this trend:
Bullish price crossover with adaptative moving average 20
Type : Bullish
Timeframe : Daily
In fact, only 8 technical indicators out of 18 studied are currently positioned bearish. Caution: the Central Indicators scanner currently detects an excess:
MACD indicator: bullish divergence
Type : Bullish
Timeframe : Daily
RSI indicator: bullish divergence
Type : Bullish
Timeframe : Daily
RSI indicator is back over 50
Type : Bullish
Timeframe : Daily
Price is back over the pivot point
Type : Bullish
Timeframe : Daily
Central Patterns, the market scanner focusing on chart patterns, resistances and supports found these results:
Near horizontal support
Type : Bullish
Timeframe : Daily
Support of channel is broken
Type : Bearish
Timeframe : Daily
No result was found by the Central Candlesticks scanner on Japanese candlesticks.
ProTrendLines
S3
S2
S1
R1
R2
R3
Price
| S3 | S2 | S1 | Price | R1 | R2 | R3 | |
|---|---|---|---|---|---|---|---|
| ProTrendLines | 212.7 | 218.7 | 227.3 | 236.7 | 236.8 | 242.1 | 245.5 |
| Change (%) | -10.14% | -7.60% | -3.97% | - | +0.04% | +2.28% | +3.72% |
| Change | -24.0 | -18.0 | -9.4 | - | +0.1 | +5.4 | +8.8 |
| Level | Intermediate | Major | Major | - | Major | Intermediate | Major |
To determine price objectives, it is also possible to use the pivot points. Here is the price position in relation to pivot points:
Daily
| Pivot points | S3 | S2 | S1 | PP | R1 | R2 | R3 |
|---|---|---|---|---|---|---|---|
| Standard | 233.8 | 234.8 | 236.4 | 237.4 | 239.0 | 240.0 | 241.6 |
| Camarilla | 237.2 | 237.4 | 237.7 | 237.9 | 238.1 | 238.4 | 238.6 |
| Woodie | 234.0 | 235.0 | 236.6 | 237.6 | 239.2 | 240.2 | 241.8 |
| Fibonacci | 234.8 | 235.8 | 236.4 | 237.4 | 238.4 | 239.0 | 240.0 |
Weekly
| Pivot points | S3 | S2 | S1 | PP | R1 | R2 | R3 |
|---|---|---|---|---|---|---|---|
| Standard | 224.1 | 228.3 | 233.1 | 237.3 | 242.1 | 246.3 | 251.1 |
| Camarilla | 235.4 | 236.3 | 237.1 | 237.9 | 238.7 | 239.6 | 240.4 |
| Woodie | 224.4 | 228.5 | 233.4 | 237.5 | 242.4 | 246.5 | 251.4 |
| Fibonacci | 228.3 | 231.7 | 233.9 | 237.3 | 240.7 | 242.9 | 246.3 |
Monthly
| Pivot points | S3 | S2 | S1 | PP | R1 | R2 | R3 |
|---|---|---|---|---|---|---|---|
| Standard | 194.5 | 207.6 | 221.4 | 234.5 | 248.3 | 261.4 | 275.2 |
| Camarilla | 227.8 | 230.3 | 232.7 | 235.2 | 237.7 | 240.1 | 242.6 |
| Woodie | 194.9 | 207.8 | 221.8 | 234.7 | 248.7 | 261.6 | 275.6 |
| Fibonacci | 207.6 | 217.9 | 224.2 | 234.5 | 244.8 | 251.1 | 261.4 |
Numerical data
The following are the details of the technical indicators and moving averages that were collected to generate this technical analysis:
Technical indicators
Moving averages
| RSI (14): | 50.50 | |
| MACD (12,26,9): | 1.0000 | |
| Directional Movement: | -3.8 | |
| AROON (14): | -57.1 | |
| DEMA (21): | 240.2 | |
| Parabolic SAR (0,02-0,02-0,2): | 246.2 | |
| Elder Ray (13): | -0.4 | |
| Super Trend (3,10): | 226.8 | |
| Zig ZAG (10): | 237.7 | |
| VORTEX (21): | 1.0000 | |
| Stochastique (14,3,5): | 29.40 | |
| TEMA (21): | 238.7 | |
| Williams %R (14): | -65.60 | |
| Chande Momentum Oscillator (20): | -4.9 | |
| Repulse (5,40,3): | -0.4000 | |
| ROCnROLL: | -1 | |
| TRIX (15,9): | 0.1000 | |
| Courbe Coppock: | 0.50 |
| MA7: | 237.8 | |
| MA20: | 238.6 | |
| MA50: | 233.8 | |
| MA100: | 229.2 | |
| MAexp7: | 238.1 | |
| MAexp20: | 238.2 | |
| MAexp50: | 234.6 | |
| MAexp100: | 231.1 | |
| Price / MA7: | -0.46% | |
| Price / MA20: | -0.80% | |
| Price / MA50: | +1.24% | |
| Price / MA100: | +3.27% | |
| Price / MAexp7: | -0.59% | |
| Price / MAexp20: | -0.63% | |
| Price / MAexp50: | +0.90% | |
| Price / MAexp100: | +2.42% |
News
The last news published on TESCO ORD 5P at the time of the generation of this analysis was as follows:
-
 US non-farm payrolls report, PMIs, RBA rate meeting and Tesco - 28 September 2019
-
The brief: Gender balance makes steady progress, Tesco warns against no-deal Brexit
-
US-China trade war outlook, China trade, UK wages, Tesco Q1 update – 8 June 2019
-
Tesco checks out of its mortgage business
-
Tesco share price | What to expect from annual results
This member declared not having a position on this financial instrument or a related financial instrument.
About author

Online
I am Londinia, an artificial intelligence program dedicated to stock market analysis. I am able to analyse and interpret graphical and market data. Learn more…


Add a comment
Comments
0 comments on the analysis TESCO ORD 6 1/3P - Daily