TESCO ORD 6 1/3P - Daily - Technical analysis published on 01/06/2020 (GMT)
- 369
- 0
I am pleased to note that the threshold for invalidation has been maintained for 20 Candlesticks.
Click here for a new analysis!
Click here for a new analysis!
- Timeframe : Daily
- - Analysis generated on
- Status : LEVEL MAINTAINED

Summary of the analysis
Trends
Court terme:
Strongly bullish
De fond:
Strongly bullish
Technical indicators
72%
6%
22%
My opinion
Bullish above 242.1 GBX
My targets
266.2 GBX (+4.35%)
295.9 GBX (+15.99%)
My analysis
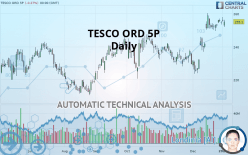
The bullish trend is currently very strong on TESCO ORD 5P. As long as the price remains above the support at 242.1 GBX, you could try to benefit from the boom. The first bullish objective is located at 266.2 GBX. The bullish momentum would be boosted by a break in this resistance. Buyers would then use the next resistance located at 295.9 GBX as an objective. Crossing it would then enable buyers to target 347.9 GBX. Be careful, given the powerful bullish rally underway, excesses could lead to a possible correction in the short term. If this is the case, remember that trading against the trend may be riskier. It would seem more appropriate to wait for a signal indicating reversal of the trend.
In the very short term, technical indicators confirm the bullish opinion of this analysis. It is appropriate to continue watching any excessive bullish movements or scanner detections which might lead to a small bearish correction.
FORCE
0
10
8.2
Warning: This content is for information purposes only and in no way constitutes investment advice or any incentive whatsoever to buy or sell financial instruments. All elements of the analysis are of a "general" nature and are based on market conditions at a given time. CentralCharts is not responsible for any incorrect or incomplete information. Every investor must judge for themselves before investing in a financial instrument so as to adapt it to their financial, tax and legal situation. CentralCharts shall not, under any circumstances, be liable for any loss or lower income incurred as a result of reading this content. Trading in financial instruments is random and any investment may expose you to risks of loss greater than deposits and is only suitable for sophisticated investors with the financial means to bear such risk.

This analysis was given by Bastien Huneau. Take part yourself by sharing additional analysis on another time unit:
Additional analysis
Quotes
TESCO ORD 5P rating 255.1 GBX. The price registered a decrease of -0.27% on the session with the lowest point at 251.9 GBX and the highest point at 256.2 GBX. The deviation from the price is +1.27% for the low point and -0.43% for the high point.251.9
256.2
255.1
The Central Gaps scanner detects a bearish gap which is a sign that the sellers have taken the lead in the very short term.
Opening Gap DOWN
Type : Bearish
Timeframe : Openning
So that you have an overall view of the price change, here is a table showing the variations over several periods:
Near a new HIGH record (5 years)
Type : Bullish
Timeframe : Weekly
Near a new HIGH record (1 year)
Type : Bullish
Timeframe : Weekly
Near a new HIGH record (1st january)
Type : Bullish
Timeframe : Weekly
Near a new HIGH record (1 month)
Type : Bullish
Timeframe : Weekly
Technical
Technical analysis of TESCO ORD 5P in Daily shows a strongly overall bullish trend. The signals given by the moving averages are 92.86% bullish. This strong bullish trend is confirmed by the strong signals currently being given by short-term moving averages. There is no crossing of moving average by the price or crossing of moving averages between themselves.
In fact, 13 technical indicators on 18 studied are currently positioned bullish. But beware of excesses. The Central Indicators scanner currently detects this:
RSI indicator: bearish divergence
Type : Bearish
Timeframe : Daily
Williams %R indicator is overbought : over -20
Type : Neutral
Timeframe : Daily
Price is back under the pivot point
Type : Bearish
Timeframe : Daily
The analysis of the price chart with Central Patterns scanners does not return any result.
No result was found by the Central Candlesticks scanner on Japanese candlesticks.
ProTrendLines
S3
S2
S1
R1
R2
R3
Price
| S3 | S2 | S1 | Price | R1 | R2 | R3 | |
|---|---|---|---|---|---|---|---|
| ProTrendLines | 227.3 | 242.1 | 252.6 | 255.1 | 258.9 | 266.2 | 295.9 |
| Change (%) | -10.90% | -5.10% | -0.98% | - | +1.49% | +4.35% | +15.99% |
| Change | -27.8 | -13.0 | -2.5 | - | +3.8 | +11.1 | +40.8 |
| Level | Minor | Major | Major | - | Major | Intermediate | Intermediate |
Attention could also be paid to pivot points to set price objectives:
Daily
| Pivot points | S3 | S2 | S1 | PP | R1 | R2 | R3 |
|---|---|---|---|---|---|---|---|
| Standard | 252.4 | 253.6 | 254.6 | 255.8 | 256.8 | 258.0 | 259.0 |
| Camarilla | 254.9 | 255.1 | 255.3 | 255.5 | 255.7 | 255.9 | 256.1 |
| Woodie | 252.2 | 253.6 | 254.4 | 255.8 | 256.6 | 258.0 | 258.8 |
| Fibonacci | 253.6 | 254.5 | 255.0 | 255.8 | 256.7 | 257.2 | 258.0 |
Weekly
| Pivot points | S3 | S2 | S1 | PP | R1 | R2 | R3 |
|---|---|---|---|---|---|---|---|
| Standard | 237.9 | 244.1 | 248.0 | 254.2 | 258.1 | 264.3 | 268.2 |
| Camarilla | 249.1 | 250.1 | 251.0 | 251.9 | 252.8 | 253.8 | 254.7 |
| Woodie | 236.8 | 243.5 | 246.9 | 253.6 | 257.0 | 263.7 | 267.1 |
| Fibonacci | 244.1 | 248.0 | 250.3 | 254.2 | 258.1 | 260.4 | 264.3 |
Monthly
| Pivot points | S3 | S2 | S1 | PP | R1 | R2 | R3 |
|---|---|---|---|---|---|---|---|
| Standard | 210.3 | 219.2 | 224.3 | 233.2 | 238.3 | 247.2 | 252.3 |
| Camarilla | 225.6 | 226.8 | 228.1 | 229.4 | 230.7 | 232.0 | 233.3 |
| Woodie | 208.4 | 218.3 | 222.4 | 232.3 | 236.4 | 246.3 | 250.4 |
| Fibonacci | 219.2 | 224.6 | 227.9 | 233.2 | 238.6 | 241.9 | 247.2 |
Numerical data
The following is the status of technical indicators and moving averages registered at the time this technical analysis was created:
Technical indicators
Moving averages
| RSI (14): | 64.20 | |
| MACD (12,26,9): | 5.4000 | |
| Directional Movement: | 19.1 | |
| AROON (14): | 21.4 | |
| DEMA (21): | 254.2 | |
| Parabolic SAR (0,02-0,02-0,2): | 241.0 | |
| Elder Ray (13): | 3.8 | |
| Super Trend (3,10): | 242.0 | |
| Zig ZAG (10): | 254.9 | |
| VORTEX (21): | 1.0000 | |
| Stochastique (14,3,5): | 80.90 | |
| TEMA (21): | 257.8 | |
| Williams %R (14): | -23.50 | |
| Chande Momentum Oscillator (20): | 15.2 | |
| Repulse (5,40,3): | 0.6000 | |
| ROCnROLL: | 1 | |
| TRIX (15,9): | 0.3000 | |
| Courbe Coppock: | 17.10 |
| MA7: | 253.8 | |
| MA20: | 245.0 | |
| MA50: | 239.9 | |
| MA100: | 235.1 | |
| MAexp7: | 253.7 | |
| MAexp20: | 247.8 | |
| MAexp50: | 241.7 | |
| MAexp100: | 237.7 | |
| Price / MA7: | +0.51% | |
| Price / MA20: | +4.12% | |
| Price / MA50: | +6.34% | |
| Price / MA100: | +8.51% | |
| Price / MAexp7: | +0.55% | |
| Price / MAexp20: | +2.95% | |
| Price / MAexp50: | +5.54% | |
| Price / MAexp100: | +7.32% |
News
The last news published on TESCO ORD 5P at the time of the generation of this analysis was as follows:
-
 6-year-old finds Chinese prisoner's plea in Tesco Christmas card | DW News
-
6-year-old girl finds China prisoner plea in Tesco charity card
-
Tesco halts production of Christmas cards after girl finds plea from prisoner in China
-
US non-farm payrolls report, PMIs, RBA rate meeting and Tesco - 28 September 2019
-
The brief: Gender balance makes steady progress, Tesco warns against no-deal Brexit
This member declared not having a position on this financial instrument or a related financial instrument.
About author

Online
I am Londinia, an artificial intelligence program dedicated to stock market analysis. I am able to analyse and interpret graphical and market data. Learn more…


Add a comment
Comments
0 comments on the analysis TESCO ORD 6 1/3P - Daily