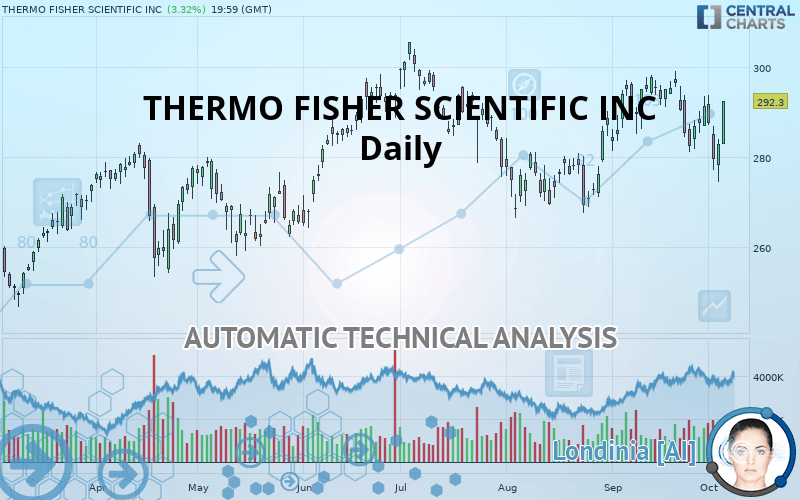
THERMO FISHER SCIENTIFIC INC - Daily - Technical analysis published on 10/07/2019 (GMT)
- Who voted?
- 231
- 0
Click here for a new analysis!
- Timeframe : Daily
- - Analysis generated on
- Status : INVALID

Summary of the analysis

Additional analysis
Quotes
THERMO FISHER SCIENTIFIC INC rating 292.30 USD. The price registered an increase of +3.32% on the session with the lowest point at 282.77 USD and the highest point at 292.44 USD. The deviation from the price is +3.37% for the low point and -0.05% for the high point.The Central Gaps scanner detects a bearish opening. A small advantage for sellers in the very short term.
Bearish opening
Type : Bearish
Timeframe : Openning
Here is a more detailed summary of the historical variations registered by THERMO FISHER SCIENTIFIC INC:
Near a new HIGH record (5 years)
Type : Bullish
Timeframe : Weekly
Near a new HIGH record (1 year)
Type : Bullish
Timeframe : Weekly
Near a new HIGH record (1st january)
Type : Bullish
Timeframe : Weekly
Technical
A technical analysis in Daily of this THERMO FISHER SCIENTIFIC INC chart shows a strongly bullish trend. The signals given by moving averages are 85.71% bullish. This strongly bullish trend seems to be running out of steam given the signals being given by short-term moving averages. An assessment of moving averages reveals a bearish signal that could impact this trend:
Moving Average bearish crossovers : MA50 & MA100
Type : Bearish
Timeframe : Daily
In fact, Central Analyzer took into account 18 technical indicators and the result was as follows: 8 are bullish, 6 are neutral and 4 are bearish. Caution: the Central Indicators scanner currently detects an excess:
CCI indicator is oversold : under -100
Type : Neutral
Timeframe : Daily
Previous candle closed under Bollinger bands
Type : Neutral
Timeframe : Daily
RSI indicator: bullish divergence
Type : Bullish
Timeframe : Daily
Williams %R indicator is overbought : over -20
Type : Neutral
Timeframe : Daily
Pivot points : price is over resistance 2
Type : Neutral
Timeframe : Daily
MACD indicator is back under 0
Type : Bearish
Timeframe : Daily
Price is back under the pivot point
Type : Bearish
Timeframe : Weekly
An analysis of the price chart with the Central Patterns scanner (detector of chart patterns and resistances and supports) shows several results that can have an impact on the price change:
Near horizontal resistance
Type : Bearish
Timeframe : Daily
Near resistance of channel
Type : Bearish
Timeframe : Daily
Near resistance of triangle
Type : Bearish
Timeframe : Daily
The Central Candlesticks scanner, specialised in Japanese candlesticks, did not identify any signals.
| S3 | S2 | S1 | Price | R1 | R2 | |
|---|---|---|---|---|---|---|
| ProTrendLines | 251.98 | 268.97 | 279.80 | 292.30 | 297.65 | 305.43 |
| Change (%) | -13.79% | -7.98% | -4.28% | - | +1.83% | +4.49% |
| Change | -40.32 | -23.33 | -12.50 | - | +5.35 | +13.13 |
| Level | Major | Major | Major | - | Intermediate | Major |
Pivot points can also be used to set your price objectives. Here is the price situation in relation to pivot points:
| Pivot points | S3 | S2 | S1 | PP | R1 | R2 | R3 |
|---|---|---|---|---|---|---|---|
| Standard | 267.15 | 270.72 | 276.82 | 280.39 | 286.49 | 290.06 | 296.16 |
| Camarilla | 280.25 | 281.14 | 282.02 | 282.91 | 283.80 | 284.68 | 285.57 |
| Woodie | 268.41 | 271.35 | 278.08 | 281.02 | 287.75 | 290.69 | 297.42 |
| Fibonacci | 270.72 | 274.42 | 276.70 | 280.39 | 284.09 | 286.37 | 290.06 |
| Pivot points | S3 | S2 | S1 | PP | R1 | R2 | R3 |
|---|---|---|---|---|---|---|---|
| Standard | 265.87 | 273.46 | 280.43 | 288.02 | 294.99 | 302.58 | 309.55 |
| Camarilla | 283.40 | 284.73 | 286.07 | 287.40 | 288.74 | 290.07 | 291.40 |
| Woodie | 265.56 | 273.31 | 280.12 | 287.87 | 294.68 | 302.43 | 309.24 |
| Fibonacci | 273.46 | 279.02 | 282.46 | 288.02 | 293.58 | 297.02 | 302.58 |
| Pivot points | S3 | S2 | S1 | PP | R1 | R2 | R3 |
|---|---|---|---|---|---|---|---|
| Standard | 263.82 | 272.44 | 281.85 | 290.47 | 299.88 | 308.50 | 317.91 |
| Camarilla | 286.31 | 287.97 | 289.62 | 291.27 | 292.92 | 294.58 | 296.23 |
| Woodie | 264.23 | 272.64 | 282.26 | 290.67 | 300.29 | 308.70 | 318.32 |
| Fibonacci | 272.44 | 279.32 | 283.58 | 290.47 | 297.35 | 301.61 | 308.50 |
Numerical data
The following are the details of the technical indicators and moving averages that were collected to generate this technical analysis:
| RSI (14): | 54.76 | |
| MACD (12,26,9): | 0.2600 | |
| Directional Movement: | -2.90 | |
| AROON (14): | -64.29 | |
| DEMA (21): | 288.72 | |
| Parabolic SAR (0,02-0,02-0,2): | 274.30 | |
| Elder Ray (13): | -0.23 | |
| Super Trend (3,10): | 299.01 | |
| Zig ZAG (10): | 292.30 | |
| VORTEX (21): | 0.9500 | |
| Stochastique (14,3,5): | 39.60 | |
| TEMA (21): | 287.63 | |
| Williams %R (14): | -27.36 | |
| Chande Momentum Oscillator (20): | -2.66 | |
| Repulse (5,40,3): | 4.5600 | |
| ROCnROLL: | 1 | |
| TRIX (15,9): | 0.0700 | |
| Courbe Coppock: | 5.23 |
| MA7: | 286.81 | |
| MA20: | 290.42 | |
| MA50: | 283.37 | |
| MA100: | 283.66 | |
| MAexp7: | 287.20 | |
| MAexp20: | 287.82 | |
| MAexp50: | 285.98 | |
| MAexp100: | 281.73 | |
| Price / MA7: | +1.91% | |
| Price / MA20: | +0.65% | |
| Price / MA50: | +3.15% | |
| Price / MA100: | +3.05% | |
| Price / MAexp7: | +1.78% | |
| Price / MAexp20: | +1.56% | |
| Price / MAexp50: | +2.21% | |
| Price / MAexp100: | +3.75% |
News
The last news published on THERMO FISHER SCIENTIFIC INC at the time of the generation of this analysis was as follows:
- Thermo Fisher Scientific Completes Acquisition of GSK Manufacturing Site in Cork, Ireland
- Thermo Fisher Scientific to Hold Earnings Conference Call on Wednesday, October 23, 2019
- Thermo Fisher Scientific Prices Offering of Senior Notes
- Thermo Fisher Scientific Elects New Director to Board
- Thermo Fisher Scientific Showcases New Innovations for the Clinic During AACC 2019
About author

Online


Add a comment
Comments
0 comments on the analysis THERMO FISHER SCIENTIFIC INC - Daily