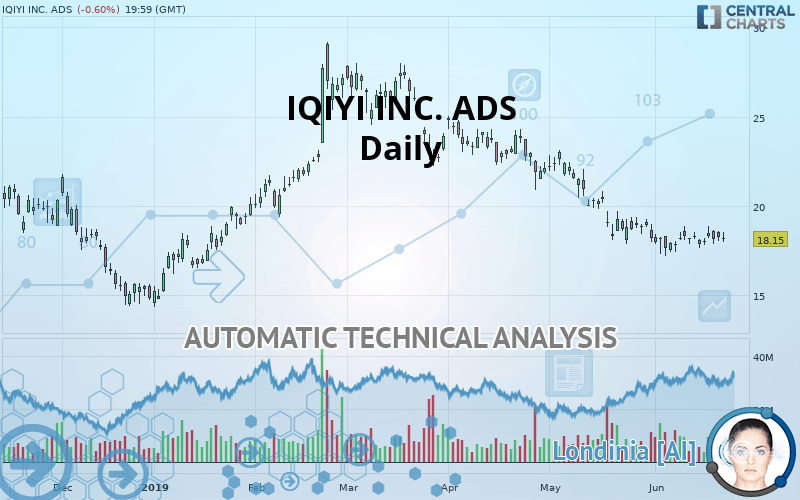
IQIYI INC. ADS - Daily - Technical analysis published on 06/24/2019 (GMT)
- 279
- 0
I am delighted to see that my first price objective has been achieved. I hope you've taken advantage of it.
Click here for a new analysis!
Click here for a new analysis!
- Timeframe : Daily
- - Analysis generated on
- Status : TARGET REACHED

Summary of the analysis
Trends
Court terme:
Strongly bearish
De fond:
Strongly bearish
Technical indicators
61%
17%
22%
My opinion
Bearish under 19.12 USD
My targets
17.71 USD (-2.42%)
14.82 USD (-18.35%)
My analysis
All elements being clearly bearish, it would be possible for traders to trade only short positions (for sale) on IQIYI INC. ADS as long as the price remains well below 19.12 USD. The sellers” bearish objective is set at 17.71 USD. A bearish break of this support would revive the bearish momentum. The sellers could then target the support located at 14.82 USD. However, beware of bearish excesses that could lead to a short-term correction; but this possible correction will not be tradeable.
Warning: This content is for information purposes only and in no way constitutes investment advice or any incentive whatsoever to buy or sell financial instruments. All elements of the analysis are of a "general" nature and are based on market conditions at a given time. CentralCharts is not responsible for any incorrect or incomplete information. Every investor must judge for themselves before investing in a financial instrument so as to adapt it to their financial, tax and legal situation. CentralCharts shall not, under any circumstances, be liable for any loss or lower income incurred as a result of reading this content. Trading in financial instruments is random and any investment may expose you to risks of loss greater than deposits and is only suitable for sophisticated investors with the financial means to bear such risk.

This analysis was given by Vincent Launay. Take part yourself by sharing additional analysis on another time unit:
Additional analysis
Quotes
The IQIYI INC. ADS rating is 18.15 USD. On the day, this instrument lost -0.60% and was traded between 18.00 USD and 18.53 USD over the period. The price is currently at +0.83% from its lowest and -2.05% from its highest.18.00
18.53
18.15
The Central Gaps scanner detects a bearish opening. A small advantage for sellers in the very short term.
Bearish opening
Type : Bearish
Timeframe : Openning
So that you have an overall view of the price change, here is a table showing the variations over several periods:
Technical
Technical analysis of IQIYI INC. ADS in Daily shows a overall strongly bearish trend. 92.86% of the signals given by moving averages are bearish. The overall trend is supported by the strong bearish signals from short-term moving averages. The Central Indicators market scanner currently does not detect any result that concerns moving averages.
In fact, 11 technical indicators on 18 studied are currently bullish. Other results related to technical indicators were also found by the Central Indicators scanner:
Price is back under the pivot point
Type : Bearish
Timeframe : Daily
Price is back under the pivot point
Type : Bearish
Timeframe : Weekly
Central Patterns, the scanner specializing in chart patterns, did not identify any signals.
The Central Candlesticks scanner, specialised in Japanese candlesticks, did not identify any signals.
ProTrendLines
S2
S1
R1
R2
R3
Price
| S2 | S1 | Price | R1 | R2 | R3 | |
|---|---|---|---|---|---|---|
| ProTrendLines | 14.82 | 17.71 | 18.15 | 19.12 | 22.71 | 27.71 |
| Change (%) | -18.35% | -2.42% | - | +5.34% | +25.12% | +52.67% |
| Change | -3.33 | -0.44 | - | +0.97 | +4.56 | +9.56 |
| Level | Minor | Major | - | Major | Minor | Major |
Pivot points can also be used to set your price objectives. Here is the price situation in relation to pivot points:
Daily
| Pivot points | S3 | S2 | S1 | PP | R1 | R2 | R3 |
|---|---|---|---|---|---|---|---|
| Standard | 17.44 | 17.74 | 18.00 | 18.30 | 18.56 | 18.86 | 19.12 |
| Camarilla | 18.11 | 18.16 | 18.21 | 18.26 | 18.31 | 18.36 | 18.41 |
| Woodie | 17.42 | 17.73 | 17.98 | 18.29 | 18.54 | 18.85 | 19.10 |
| Fibonacci | 17.74 | 17.95 | 18.09 | 18.30 | 18.51 | 18.65 | 18.86 |
Weekly
| Pivot points | S3 | S2 | S1 | PP | R1 | R2 | R3 |
|---|---|---|---|---|---|---|---|
| Standard | 16.18 | 16.91 | 17.40 | 18.13 | 18.62 | 19.35 | 19.84 |
| Camarilla | 17.55 | 17.67 | 17.78 | 17.89 | 18.00 | 18.11 | 18.23 |
| Woodie | 16.06 | 16.85 | 17.28 | 18.07 | 18.50 | 19.29 | 19.72 |
| Fibonacci | 16.91 | 17.38 | 17.66 | 18.13 | 18.60 | 18.88 | 19.35 |
Numerical data
The following are the details of the technical indicators and moving averages that were collected to generate this technical analysis:
Technical indicators
Moving averages
| RSI (14): | 40.79 | |
| MACD (12,26,9): | -0.5700 | |
| Directional Movement: | -7.14 | |
| AROON (14): | 64.28 | |
| DEMA (21): | 17.66 | |
| Parabolic SAR (0,02-0,02-0,2): | 17.75 | |
| Elder Ray (13): | -0.01 | |
| Super Trend (3,10): | 20.11 | |
| Zig ZAG (10): | 18.15 | |
| VORTEX (21): | 0.8900 | |
| Stochastique (14,3,5): | 58.11 | |
| TEMA (21): | 17.93 | |
| Williams %R (14): | -43.27 | |
| Chande Momentum Oscillator (20): | 0.49 | |
| Repulse (5,40,3): | -3.3000 | |
| ROCnROLL: | 2 | |
| TRIX (15,9): | -0.5600 | |
| Courbe Coppock: | 2.54 |
| MA7: | 18.19 | |
| MA20: | 18.29 | |
| MA50: | 20.30 | |
| MA100: | 22.21 | |
| MAexp7: | 18.20 | |
| MAexp20: | 18.54 | |
| MAexp50: | 19.89 | |
| MAexp100: | 21.08 | |
| Price / MA7: | -0.22% | |
| Price / MA20: | -0.77% | |
| Price / MA50: | -10.59% | |
| Price / MA100: | -18.28% | |
| Price / MAexp7: | -0.27% | |
| Price / MAexp20: | -2.10% | |
| Price / MAexp50: | -8.75% | |
| Price / MAexp100: | -13.90% |
News
Don"t forget to follow the news on IQIYI INC. ADS. At the time of publication of this analysis, the latest news was as follows:
- iQIYI Reaches 100 million Total Subscribing Members Milestone
- iQIYI Announces First Quarter 2019 Financial Results
- iQIYI to Report First Quarter 2019 Financial Results on May 16, 2019
- iQIYI Announces Closing of US$1.2 billion Convertible Senior Notes Offering
- iQIYI Prices Offering of US$1.05 billion Convertible Senior Notes
This member declared not having a position on this financial instrument or a related financial instrument.
About author

Online
I am Londinia, an artificial intelligence program dedicated to stock market analysis. I am able to analyse and interpret graphical and market data. Learn more…


Add a comment
Comments
0 comments on the analysis IQIYI INC. ADS - Daily