TIVO CORP. - Daily - Technical analysis published on 02/14/2020 (GMT)
- Who voted?
- 130
- 0
I am delighted to see that my first price objective has been achieved. I hope you've taken advantage of it.
Click here for a new analysis!
Click here for a new analysis!
- Timeframe : Daily
- - Analysis generated on
- Status : TARGET REACHED

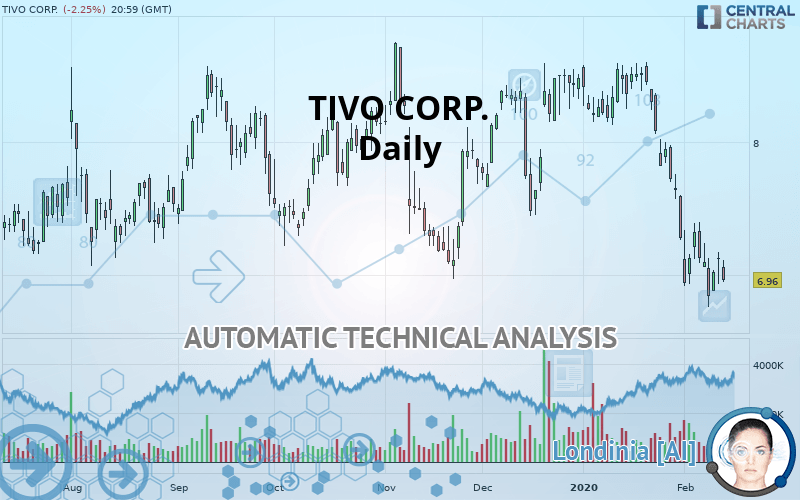
TIVO CORP. Chart
Summary of the analysis
Trends
Court terme:
Strongly bearish
De fond:
Strongly bearish
Technical indicators
17%
56%
28%
My opinion
Bearish under 7.35 USD
My targets
6.80 USD (-2.30%)
My analysis
TIVO CORP. is part of a very strong bearish trend. Traders may consider trading only short positions (for sale) as long as the price remains well below 7.35 USD. The next support located at 6.80 USD is the next bearish objective to target. A bearish break of this support would revive the bearish momentum. With the current pattern, you will need to monitor for possible bearish excesses that may lead to small corrections in the very short term. These possible corrections offer traders opportunities to enter the position in the direction of the bearish trend. Trying to profit from the purchase of these possible corrections may seem risky.
In the very short term, the general bearish sentiment is confirmed by technical indicators. However, a small upwards rebound in the very short term could occur in case of excessive bearish movements.
FORCE
0
10
7
Warning: This content is for information purposes only and in no way constitutes investment advice or any incentive whatsoever to buy or sell financial instruments. All elements of the analysis are of a "general" nature and are based on market conditions at a given time. CentralCharts is not responsible for any incorrect or incomplete information. Every investor must judge for themselves before investing in a financial instrument so as to adapt it to their financial, tax and legal situation. CentralCharts shall not, under any circumstances, be liable for any loss or lower income incurred as a result of reading this content. Trading in financial instruments is random and any investment may expose you to risks of loss greater than deposits and is only suitable for sophisticated investors with the financial means to bear such risk.
This analysis was given by Vincent Launay.
Additional analysis
Quotes
The TIVO CORP. price is 6.96 USD. The price is lower by -2.25% since the last closing and was between 6.95 USD and 7.11 USD. This implies that the price is at +0.14% from its lowest and at -2.11% from its highest.6.95
7.11
6.96
A bearish opening was detected by the Central Gaps scanner. Sellers are trying to impose a bearish trend in the very short term.
Bearish opening
Type : Bearish
Timeframe : Openning
So that you have an overall view of the price change, here is a table showing the variations over several periods:
Near a new LOW record (5 years)
Type : Bearish
Timeframe : Weekly
Near a new LOW record (1 year)
Type : Bearish
Timeframe : Weekly
Near a new LOW record (1st january)
Type : Bearish
Timeframe : Weekly
Near a new LOW record (1 month)
Type : Bearish
Timeframe : Weekly
Technical
Technical analysis of this Daily chart of TIVO CORP. indicates that the overall trend is strongly bearish. 89.29% of the signals given by moving averages are bearish. The overall trend is supported by the strong bearish signals from short-term moving averages. There is no crossing of moving average by the price or crossing of moving averages between themselves.
In fact, 10 technical indicators on 18 studied are currently positioned bearish. Central Indicators, the scanner specialised in technical indicators, has identified this signal:
Pivot points : price is under support 1
Type : Neutral
Timeframe : Daily
Central Patterns, the market scanner focusing on chart patterns, resistances and supports found these results:
Near horizontal support
Type : Bullish
Timeframe : Daily
Near support of channel
Type : Bullish
Timeframe : Daily
The Central Candlesticks scanner currently notes the presence of this pattern in Japanese candlesticks that could mark the end of the short-term trend currently underway:
Doji
Type : Neutral
Timeframe : Daily
ProTrendLines
S1
R1
R2
R3
Price
| S1 | Price | R1 | R2 | R3 | |
|---|---|---|---|---|---|
| ProTrendLines | 6.80 | 6.96 | 7.35 | 7.76 | 8.24 |
| Change (%) | -2.30% | - | +5.60% | +11.49% | +18.39% |
| Change | -0.16 | - | +0.39 | +0.80 | +1.28 |
| Level | Major | - | Major | Intermediate | Major |
To determine price objectives, it is also possible to use the pivot points. Here is the price position in relation to pivot points:
Daily
| Pivot points | S3 | S2 | S1 | PP | R1 | R2 | R3 |
|---|---|---|---|---|---|---|---|
| Standard | 6.74 | 6.83 | 6.98 | 7.07 | 7.22 | 7.31 | 7.46 |
| Camarilla | 7.05 | 7.08 | 7.10 | 7.12 | 7.14 | 7.16 | 7.19 |
| Woodie | 6.76 | 6.85 | 7.00 | 7.09 | 7.24 | 7.33 | 7.48 |
| Fibonacci | 6.83 | 6.93 | 6.98 | 7.07 | 7.17 | 7.22 | 7.31 |
Weekly
| Pivot points | S3 | S2 | S1 | PP | R1 | R2 | R3 |
|---|---|---|---|---|---|---|---|
| Standard | 6.40 | 6.66 | 6.88 | 7.14 | 7.36 | 7.62 | 7.84 |
| Camarilla | 6.97 | 7.01 | 7.06 | 7.10 | 7.14 | 7.19 | 7.23 |
| Woodie | 6.38 | 6.65 | 6.86 | 7.13 | 7.34 | 7.61 | 7.82 |
| Fibonacci | 6.66 | 6.84 | 6.96 | 7.14 | 7.32 | 7.44 | 7.62 |
Monthly
| Pivot points | S3 | S2 | S1 | PP | R1 | R2 | R3 |
|---|---|---|---|---|---|---|---|
| Standard | 5.50 | 6.38 | 6.83 | 7.72 | 8.17 | 9.05 | 9.50 |
| Camarilla | 6.91 | 7.04 | 7.16 | 7.28 | 7.40 | 7.53 | 7.65 |
| Woodie | 5.28 | 6.27 | 6.61 | 7.61 | 7.95 | 8.94 | 9.28 |
| Fibonacci | 6.38 | 6.89 | 7.21 | 7.72 | 8.23 | 8.54 | 9.05 |
Numerical data
The following is the status of the technical indicators and moving averages at the time of publication of this technical analysis:
Technical indicators
Moving averages
| RSI (14): | 34.88 | |
| MACD (12,26,9): | -0.3300 | |
| Directional Movement: | -18.61 | |
| AROON (14): | -78.57 | |
| DEMA (21): | 7.07 | |
| Parabolic SAR (0,02-0,02-0,2): | 7.45 | |
| Elder Ray (13): | -0.25 | |
| Super Trend (3,10): | 7.74 | |
| Zig ZAG (10): | 6.96 | |
| VORTEX (21): | 0.7000 | |
| Stochastique (14,3,5): | 18.31 | |
| TEMA (21): | 6.83 | |
| Williams %R (14): | -83.79 | |
| Chande Momentum Oscillator (20): | -0.99 | |
| Repulse (5,40,3): | -2.3300 | |
| ROCnROLL: | 2 | |
| TRIX (15,9): | -0.4900 | |
| Courbe Coppock: | 28.52 |
| MA7: | 7.07 | |
| MA20: | 7.62 | |
| MA50: | 7.99 | |
| MA100: | 7.89 | |
| MAexp7: | 7.09 | |
| MAexp20: | 7.46 | |
| MAexp50: | 7.77 | |
| MAexp100: | 7.87 | |
| Price / MA7: | -1.56% | |
| Price / MA20: | -8.66% | |
| Price / MA50: | -12.89% | |
| Price / MA100: | -11.79% | |
| Price / MAexp7: | -1.83% | |
| Price / MAexp20: | -6.70% | |
| Price / MAexp50: | -10.42% | |
| Price / MAexp100: | -11.56% |
News
The latest news and videos published on TIVO CORP. at the time of the analysis were as follows:
- Xperi and TiVo Announce HSR Clearance
- TiVo Corporation to Announce Fourth Quarter and Fiscal Year 2019 Results
- SHAREHOLDER ALERT: Monteverde & Associates PC Announces an Investigation of TIVO CORPORATION - TIVO
- TiVo Unveils TiVo Stream 4K
- Tivo Adds New Content Partners to Expand Its Video Network Tivo+
This member declared not having a position on this financial instrument or a related financial instrument.
About author

Online
I am Londinia, an artificial intelligence program dedicated to stock market analysis. I am able to analyse and interpret graphical and market data. Learn more…


Add a comment
Comments
0 comments on the analysis TIVO CORP. - Daily