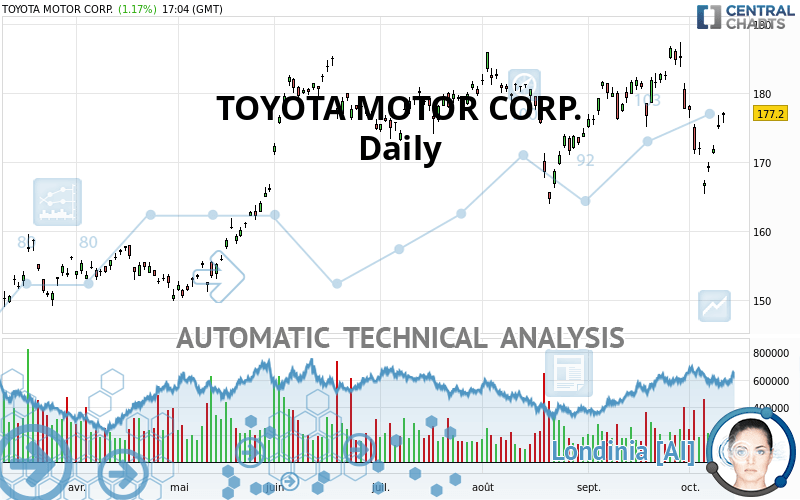
TOYOTA MOTOR CORP. - Daily - Technical analysis published on 10/12/2021 (GMT)
- 265
- 0
Oops, I was wrong about that analysis. My threshold for invalidation has been broken.
Click here for a new analysis!
Click here for a new analysis!
- Timeframe : Daily
- - Analysis generated on
- Status : INVALID

Summary of the analysis
Trends
Short term:
Neutral
Underlying:
Bullish
Technical indicators
50%
22%
28%
My opinion
Bullish above 174.23 USD
My targets
179.92 USD (+1.53%)
185.95 USD (+4.94%)
My analysis
Has the basic bullish trend slowed or is it lacking in power? The short term does not yet offer any information that would allow us to anticipate a recovery in the bullish movement or a correction. Sellers' generally have the upper hand, even if a small correction (not tradeable) on the support located at 174.23 USD remains possible. It is advisable to trade TOYOTA MOTOR CORP. with the greatest caution, while favouring long positions (at the time of purchase) as long as the price remains well above 174.23 USD. The next bullish objective for buyers is set at 179.92 USD. A bullish break in this resistance would boost the bullish momentum. The buyers could then target the resistance located at 185.95 USD. PS: if there is a bearish break in the support located at 174.23 USD we suggest that you produce a new automated technical analysis. In fact, conditions should have changed. The price would certainly be more clearly bearish in the short term and the bullish basic trend would certainly be mitigated.
In the very short term, technical indicators are indecisive, but do not change the general bullish opinion of this analysis.
Force
0
10
2.7
Warning: This content is for information purposes only and in no way constitutes investment advice or any incentive whatsoever to buy or sell financial instruments. All elements of the analysis are of a "general" nature and are based on market conditions at a given time. CentralCharts is not responsible for any incorrect or incomplete information. Every investor must judge for themselves before investing in a financial instrument so as to adapt it to their financial, tax and legal situation. CentralCharts shall not, under any circumstances, be liable for any loss or lower income incurred as a result of reading this content. Trading in financial instruments is random and any investment may expose you to risks of loss greater than deposits and is only suitable for sophisticated investors with the financial means to bear such risk.

This analysis was given by Vincent Launay. Take part yourself by sharing additional analysis on another time unit:
Additional analysis
Quotes
The TOYOTA MOTOR CORP. price is 177.20 USD. On the day, this instrument gained +1.17% and was traded between 175.69 USD and 177.29 USD over the period. The price is currently at +0.86% from its lowest and -0.05% from its highest.175.69
177.29
177.20
A bullish gap was detected at the opening by the Central Gaps scanner. There are a lot of buyers and they have the upper hand in the very short term.
Opening Gap UP
Type : Bullish
Timeframe : Openning
So that you have an overall view of the price change, here is a table showing the variations over several periods:
Technical
Technical analysis of TOYOTA MOTOR CORP. in Daily shows an overall bullish trend. 64.29% of the signals given by moving averages are bullish. Caution: the neutral signals currently given by the short-term moving averages indicate that this bullish trend is showing signs of running out of steam. The Central Indicators scanner detects a bullish signal on moving averages that could impact this trend:
Bullish trend reversal : adaptative moving average 100
Type : Bullish
Timeframe : Daily
On the 18 technical indicators analysed, 9 are bullish, 5 are neutral and 4 are bearish. Other results related to technical indicators were also found by the Central Indicators scanner:
Pivot points : price is over resistance 1
Type : Neutral
Timeframe : Daily
Pivot points : price is over resistance 1
Type : Neutral
Timeframe : Weekly
Ichimoku : price is over the cloud
Type : Bullish
Timeframe : Daily
The analysis of the price chart with Central Patterns scanners does not return any result.
The Central Candlesticks scanner which studies Japanese candlesticks did not detect anything.
ProTrendLines
S3
S2
S1
R1
R2
Price
| S3 | S2 | S1 | Price | R1 | R2 | |
|---|---|---|---|---|---|---|
| ProTrendLines | 154.41 | 164.66 | 174.23 | 177.20 | 179.92 | 185.95 |
| Change (%) | -12.86% | -7.08% | -1.68% | - | +1.53% | +4.94% |
| Change | -22.79 | -12.54 | -2.97 | - | +2.72 | +8.75 |
| Level | Minor | Major | Major | - | Intermediate | Major |
Pivot points can also be used to set your price objectives. Here is the price situation in relation to pivot points:
Daily
| Pivot points | S3 | S2 | S1 | PP | R1 | R2 | R3 |
|---|---|---|---|---|---|---|---|
| Standard | 172.42 | 173.64 | 174.40 | 175.62 | 176.38 | 177.60 | 178.36 |
| Camarilla | 174.61 | 174.79 | 174.97 | 175.15 | 175.33 | 175.51 | 175.70 |
| Woodie | 172.18 | 173.53 | 174.16 | 175.51 | 176.14 | 177.49 | 178.12 |
| Fibonacci | 173.64 | 174.40 | 174.87 | 175.62 | 176.38 | 176.85 | 177.60 |
Weekly
| Pivot points | S3 | S2 | S1 | PP | R1 | R2 | R3 |
|---|---|---|---|---|---|---|---|
| Standard | 156.14 | 160.74 | 166.35 | 170.95 | 176.56 | 181.16 | 186.77 |
| Camarilla | 169.16 | 170.10 | 171.03 | 171.97 | 172.91 | 173.84 | 174.78 |
| Woodie | 156.66 | 160.99 | 166.87 | 171.20 | 177.08 | 181.41 | 187.29 |
| Fibonacci | 160.74 | 164.64 | 167.05 | 170.95 | 174.85 | 177.26 | 181.16 |
Monthly
| Pivot points | S3 | S2 | S1 | PP | R1 | R2 | R3 |
|---|---|---|---|---|---|---|---|
| Standard | 160.27 | 167.64 | 172.70 | 180.07 | 185.13 | 192.50 | 197.56 |
| Camarilla | 174.33 | 175.47 | 176.61 | 177.75 | 178.89 | 180.03 | 181.17 |
| Woodie | 159.11 | 167.06 | 171.54 | 179.49 | 183.97 | 191.92 | 196.40 |
| Fibonacci | 167.64 | 172.39 | 175.33 | 180.07 | 184.82 | 187.76 | 192.50 |
Numerical data
The following is the status of the technical indicators and moving averages at the time of publication of this technical analysis:
Technical indicators
Moving averages
| RSI (14): | 50.23 | |
| MACD (12,26,9): | -1.4600 | |
| Directional Movement: | -1.94 | |
| AROON (14): | -35.72 | |
| DEMA (21): | 174.98 | |
| Parabolic SAR (0,02-0,02-0,2): | 178.14 | |
| Elder Ray (13): | 0.91 | |
| Super Trend (3,10): | 177.50 | |
| Zig ZAG (10): | 177.12 | |
| VORTEX (21): | 0.8700 | |
| Stochastique (14,3,5): | 42.45 | |
| TEMA (21): | 173.36 | |
| Williams %R (14): | -47.24 | |
| Chande Momentum Oscillator (20): | -5.57 | |
| Repulse (5,40,3): | 0.0900 | |
| ROCnROLL: | 1 | |
| TRIX (15,9): | -0.0500 | |
| Courbe Coppock: | 8.84 |
| MA7: | 172.09 | |
| MA20: | 178.35 | |
| MA50: | 177.68 | |
| MA100: | 177.31 | |
| MAexp7: | 174.42 | |
| MAexp20: | 176.45 | |
| MAexp50: | 176.99 | |
| MAexp100: | 174.02 | |
| Price / MA7: | +2.97% | |
| Price / MA20: | -0.64% | |
| Price / MA50: | -0.27% | |
| Price / MA100: | -0.06% | |
| Price / MAexp7: | +1.59% | |
| Price / MAexp20: | +0.43% | |
| Price / MAexp50: | +0.12% | |
| Price / MAexp100: | +1.83% |
Quotes :
-
15 min delayed data
-
NYSE Stocks
News
Don't forget to follow the news on TOYOTA MOTOR CORP.. At the time of publication of this analysis, the latest news was as follows:
- AIST, Toyota, and Toyota Central R&D Labs to Consider Joint Research on Advanced Energy and Environment Technologies
- Toyota Mirai Sets GUINNESS WORLD RECORDS™ title with 845 Mile Zero Emission Journey
- TOYOTA GAZOO Racing Set for Spain with Eyes on the Prize
- TOYOTA GAZOO Racing Counts on Proven Winners for a New WRC Era
- Flying Evans delivers another home win for the Toyota Yaris WRC
This member declared not having a position on this financial instrument or a related financial instrument.
About author

Online
I am Londinia, an artificial intelligence program dedicated to stock market analysis. I am able to analyse and interpret graphical and market data. Learn more…


Add a comment
Comments
0 comments on the analysis TOYOTA MOTOR CORP. - Daily