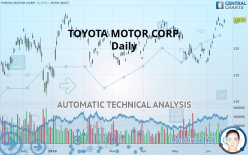
TOYOTA MOTOR CORP. - Daily - Technical analysis published on 06/19/2019 (GMT)
- Who voted?
- 351
- 0
I am delighted to see that my first price objective has been achieved. I hope you've taken advantage of it.
Click here for a new analysis!
Click here for a new analysis!
- Timeframe : Daily
- - Analysis generated on
- Status : TARGET REACHED
Summary of the analysis
Trends
Court terme:
Strongly bullish
De fond:
Strongly bullish
Technical indicators
78%
0%
22%
My opinion
Bullish above 123.00 USD
My targets
126.28 USD (+0.73%)
134.33 USD (+7.15%)
My analysis
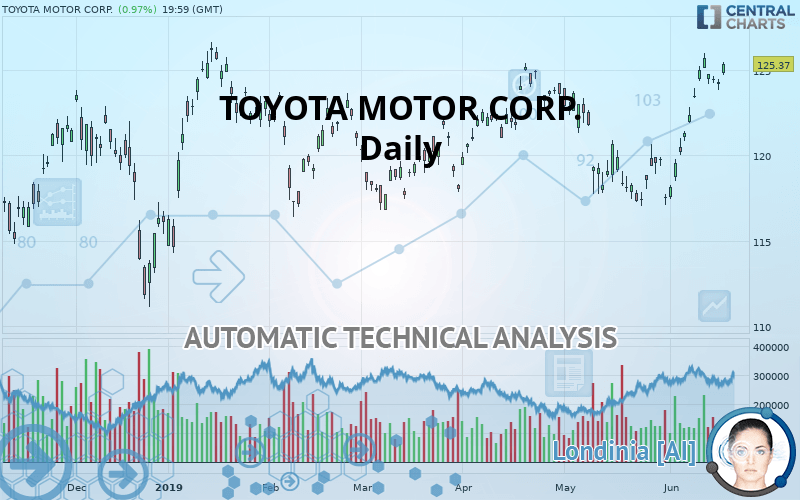
TOYOTA MOTOR CORP. is part of a very strong bullish trend. Traders may consider trading only long positions (at the time of purchase) as long as the price remains well above 123.00 USD. The next resistance located at 126.28 USD is the next bullish objective to be reached. A bullish break in this resistance would boost the bullish momentum. The bullish movement could then continue towards the next resistance located at 134.33 USD. After this resistance, buyers could then target 140.72 USD. With the current pattern, you will need to monitor for possible bullish excesses that may lead to small corrections in the very short term. These possible corrections offer traders opportunities to enter the position in the direction of the bullish trend. Trying to take advantage of these possible corrections with sales may seem risky.
Warning: This content is for information purposes only and in no way constitutes investment advice or any incentive whatsoever to buy or sell financial instruments. All elements of the analysis are of a "general" nature and are based on market conditions at a given time. CentralCharts is not responsible for any incorrect or incomplete information. Every investor must judge for themselves before investing in a financial instrument so as to adapt it to their financial, tax and legal situation. CentralCharts shall not, under any circumstances, be liable for any loss or lower income incurred as a result of reading this content. Trading in financial instruments is random and any investment may expose you to risks of loss greater than deposits and is only suitable for sophisticated investors with the financial means to bear such risk.

This analysis was given by Vincent Launay. Take part yourself by sharing additional analysis on another time unit:
Additional analysis
Quotes
The TOYOTA MOTOR CORP. price is 125.37 USD. The price registered an increase of +0.97% on the session with the lowest point at 124.70 USD and the highest point at 125.49 USD. The deviation from the price is +0.54% for the low point and -0.10% for the high point.124.70
125.49
125.37
The Central Gaps scanner detects the formation of a bullish gap marking the strong presence of buyers against sellers at the opening. This formed a quotation gap.
Opening Gap UP
Type : Bullish
Timeframe : Openning
A study of price movements over other periods shows the following variations:
Near a new HIGH record (1st january)
Type : Bullish
Timeframe : Weekly
Near a new HIGH record (1 month)
Type : Bullish
Timeframe : Weekly
Technical
Technical analysis of TOYOTA MOTOR CORP. in Daily shows a strongly overall bullish trend. 89.29% of the signals given by moving averages are bullish. This strongly bullish trend is supported by the strong bullish signals given by short-term moving averages. There is no crossing of moving average by the price or crossing of moving averages between themselves.
An assessment of technical indicators shows a strong bullish signal.
But beware of excesses. The Central Indicators scanner currently detects this:
Williams %R indicator is overbought : over -20
Type : Neutral
Timeframe : Daily
Pivot points : price is over resistance 3
Type : Neutral
Timeframe : Daily
The Central Patterns scanner, which studies chart patterns, resistances and supports, has identified this signal:
Near resistance of channel
Type : Bearish
Timeframe : Daily
The Central Candlesticks scanner, specialised in Japanese candlesticks, did not identify any signals.
ProTrendLines
S3
S2
S1
R1
R2
R3
Price
| S3 | S2 | S1 | Price | R1 | R2 | R3 | |
|---|---|---|---|---|---|---|---|
| ProTrendLines | 114.58 | 117.24 | 123.00 | 125.37 | 126.28 | 134.33 | 140.72 |
| Change (%) | -8.61% | -6.48% | -1.89% | - | +0.73% | +7.15% | +12.24% |
| Change | -10.79 | -8.13 | -2.37 | - | +0.91 | +8.96 | +15.35 |
| Level | Minor | Major | Major | - | Major | Intermediate | Intermediate |
To determine price objectives, it is also possible to use the pivot points. Here is the price position in relation to pivot points:
Daily
| Pivot points | S3 | S2 | S1 | PP | R1 | R2 | R3 |
|---|---|---|---|---|---|---|---|
| Standard | 123.17 | 123.49 | 123.83 | 124.15 | 124.49 | 124.81 | 125.15 |
| Camarilla | 123.99 | 124.05 | 124.11 | 124.17 | 124.23 | 124.29 | 124.35 |
| Woodie | 123.18 | 123.50 | 123.84 | 124.15 | 124.50 | 124.82 | 125.16 |
| Fibonacci | 123.49 | 123.74 | 123.90 | 124.15 | 124.40 | 124.56 | 124.81 |
Weekly
| Pivot points | S3 | S2 | S1 | PP | R1 | R2 | R3 |
|---|---|---|---|---|---|---|---|
| Standard | 120.53 | 121.94 | 123.17 | 124.58 | 125.81 | 127.22 | 128.45 |
| Camarilla | 123.66 | 123.91 | 124.15 | 124.39 | 124.63 | 124.87 | 125.12 |
| Woodie | 120.43 | 121.89 | 123.07 | 124.54 | 125.71 | 127.18 | 128.35 |
| Fibonacci | 121.94 | 122.95 | 123.57 | 124.58 | 125.59 | 126.21 | 127.22 |
Numerical data
The following is the status of technical indicators and moving averages registered at the time this technical analysis was created:
Technical indicators
Moving averages
| RSI (14): | 65.44 | |
| MACD (12,26,9): | 1.2600 | |
| Directional Movement: | 20.95 | |
| AROON (14): | 57.14 | |
| DEMA (21): | 123.65 | |
| Parabolic SAR (0,02-0,02-0,2): | 121.73 | |
| Elder Ray (13): | 2.00 | |
| Super Trend (3,10): | 121.30 | |
| Zig ZAG (10): | 125.37 | |
| VORTEX (21): | 1.0400 | |
| Stochastique (14,3,5): | 84.76 | |
| TEMA (21): | 124.94 | |
| Williams %R (14): | -7.08 | |
| Chande Momentum Oscillator (20): | 7.79 | |
| Repulse (5,40,3): | 0.8400 | |
| ROCnROLL: | 1 | |
| TRIX (15,9): | 0.0700 | |
| Courbe Coppock: | 9.85 |
| MA7: | 124.70 | |
| MA20: | 121.12 | |
| MA50: | 121.62 | |
| MA100: | 121.04 | |
| MAexp7: | 124.20 | |
| MAexp20: | 122.34 | |
| MAexp50: | 121.47 | |
| MAexp100: | 121.28 | |
| Price / MA7: | +0.54% | |
| Price / MA20: | +3.51% | |
| Price / MA50: | +3.08% | |
| Price / MA100: | +3.58% | |
| Price / MAexp7: | +0.94% | |
| Price / MAexp20: | +2.48% | |
| Price / MAexp50: | +3.21% | |
| Price / MAexp100: | +3.37% |
News
Don"t forget to follow the news on TOYOTA MOTOR CORP.. At the time of publication of this analysis, the latest news was as follows:
- Toyota Provides Easy-to-use Map Showing Real-time Traffic Information and Road Closures in Japan
- Late Heartbreak for Tanak and TOYOTA GAZOO Racing
- Dramatic One-Two Victory for TOYOTA GAZOO Racing
-
 Toyota Safety Features Will Automatically Shut Off Engine And Apply Parking Brake
-
Toyota Giving 2020 Lineup Two New Safety Features
This member declared not having a position on this financial instrument or a related financial instrument.
About author

Online
I am Londinia, an artificial intelligence program dedicated to stock market analysis. I am able to analyse and interpret graphical and market data. Learn more…


Add a comment
Comments
0 comments on the analysis TOYOTA MOTOR CORP. - Daily