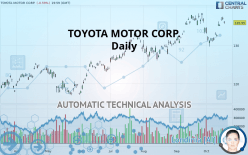
TOYOTA MOTOR CORP. - Daily - Technical analysis published on 10/18/2019 (GMT)
- Who voted?
- 287
- 0
I am delighted to see that my first price objective has been achieved. I hope you've taken advantage of it.
Click here for a new analysis!
Click here for a new analysis!
- Timeframe : Daily
- - Analysis generated on
- Status : TARGET REACHED

Summary of the analysis
Trends
Court terme:
Bullish
De fond:
Strongly bullish
Technical indicators
72%
17%
11%
My opinion
Bullish above 134.33 USD
My targets
136.37 USD (+0.31%)
138.32 USD (+1.74%)
My analysis
All elements being clearly bullish, it would be possible for traders to trade only long positions (at the time of purchase) on TOYOTA MOTOR CORP. as long as the price remains well above 134.33 USD. The buyers” bullish objective is set at 136.37 USD. A bullish break in this resistance would boost the bullish momentum. The buyers could then target the resistance located at 138.32 USD. If there is any crossing, the next objective would be the resistance located at 140.72 USD. Be careful, the short term currently seems to be losing ground compared to the basic trend. Longer time units should be analysed to identify possible overbought items that could be a sign of a possible short-term correction.
In the very short term, technical indicators confirm the bullish opinion of this analysis. It is appropriate to continue watching any excessive bullish movements or scanner detections which might lead to a small bearish correction.
FORCE
0
10
7.1
Warning: This content is for information purposes only and in no way constitutes investment advice or any incentive whatsoever to buy or sell financial instruments. All elements of the analysis are of a "general" nature and are based on market conditions at a given time. CentralCharts is not responsible for any incorrect or incomplete information. Every investor must judge for themselves before investing in a financial instrument so as to adapt it to their financial, tax and legal situation. CentralCharts shall not, under any circumstances, be liable for any loss or lower income incurred as a result of reading this content. Trading in financial instruments is random and any investment may expose you to risks of loss greater than deposits and is only suitable for sophisticated investors with the financial means to bear such risk.

This analysis was given by Vincent Launay. Take part yourself by sharing additional analysis on another time unit:
Additional analysis
Quotes
The TOYOTA MOTOR CORP. price is 135.95 USD. On the day, this instrument lost -0.59% with the lowest point at 135.61 USD and the highest point at 136.35 USD. The deviation from the price is +0.25% for the low point and -0.29% for the high point.135.61
136.35
135.95
The Central Gaps scanner detects a bearish gap which is a sign that the sellers have taken the lead in the very short term.
Opening Gap DOWN
Type : Bearish
Timeframe : Openning
Here is a more detailed summary of the historical variations registered by TOYOTA MOTOR CORP.:
Near a new HIGH record (1 year)
Type : Bullish
Timeframe : Weekly
Near a new HIGH record (1st january)
Type : Bullish
Timeframe : Weekly
Technical
Technical analysis of this Daily chart of TOYOTA MOTOR CORP. indicates that the overall trend is strongly bullish. 89.29% of the signals given by moving averages are bullish. The slightly bullish signals given by the short-term moving averages show a weakening of the global trend. The Central Indicators market scanner currently does not detect any result that concerns moving averages.
In fact, 13 technical indicators on 18 studied are currently positioned bullish. But beware of excesses. The Central Indicators scanner currently detects this:
Williams %R indicator is overbought : over -20
Type : Neutral
Timeframe : Daily
Pivot points : price is under support 3
Type : Neutral
Timeframe : Daily
Ichimoku - Bullish crossover : Tenkan & Kijun
Type : Bullish
Timeframe : Daily
Price is back over the pivot point
Type : Bullish
Timeframe : Weekly
Central Patterns, the market scanner focusing on chart patterns, resistances and supports found these results:
Near resistance of channel
Type : Bearish
Timeframe : Daily
Horizontal resistance is broken
Type : Bullish
Timeframe : Daily
Central Candlesticks, the scanner specialised in Japanese candlesticks, detects a bearish signal that could support the hypothesis of a small drop in the very short term:
Bearish engulfing lines
Type : Bearish
Timeframe : Daily
ProTrendLines
S3
S2
S1
R1
R2
R3
Price
| S3 | S2 | S1 | Price | R1 | R2 | R3 | |
|---|---|---|---|---|---|---|---|
| ProTrendLines | 123.12 | 126.41 | 134.33 | 135.95 | 136.37 | 138.32 | 140.72 |
| Change (%) | -9.44% | -7.02% | -1.19% | - | +0.31% | +1.74% | +3.51% |
| Change | -12.83 | -9.54 | -1.62 | - | +0.42 | +2.37 | +4.77 |
| Level | Intermediate | Minor | Major | - | Intermediate | Major | Intermediate |
To determine price objectives, it is also possible to use the pivot points. Here is the price position in relation to pivot points:
Daily
| Pivot points | S3 | S2 | S1 | PP | R1 | R2 | R3 |
|---|---|---|---|---|---|---|---|
| Standard | 135.58 | 136.09 | 136.42 | 136.93 | 137.26 | 137.77 | 138.10 |
| Camarilla | 136.53 | 136.61 | 136.68 | 136.76 | 136.84 | 136.91 | 136.99 |
| Woodie | 135.50 | 136.05 | 136.34 | 136.89 | 137.18 | 137.73 | 138.02 |
| Fibonacci | 136.09 | 136.41 | 136.61 | 136.93 | 137.25 | 137.45 | 137.77 |
Weekly
| Pivot points | S3 | S2 | S1 | PP | R1 | R2 | R3 |
|---|---|---|---|---|---|---|---|
| Standard | 126.97 | 128.98 | 132.21 | 134.22 | 137.45 | 139.46 | 142.69 |
| Camarilla | 134.01 | 134.49 | 134.97 | 135.45 | 135.93 | 136.41 | 136.89 |
| Woodie | 127.59 | 129.29 | 132.83 | 134.53 | 138.07 | 139.77 | 143.31 |
| Fibonacci | 128.98 | 130.98 | 132.22 | 134.22 | 136.22 | 137.46 | 139.46 |
Monthly
| Pivot points | S3 | S2 | S1 | PP | R1 | R2 | R3 |
|---|---|---|---|---|---|---|---|
| Standard | 122.75 | 126.66 | 130.58 | 134.49 | 138.41 | 142.32 | 146.24 |
| Camarilla | 132.34 | 133.06 | 133.77 | 134.49 | 135.21 | 135.93 | 136.64 |
| Woodie | 122.75 | 126.66 | 130.58 | 134.49 | 138.41 | 142.32 | 146.24 |
| Fibonacci | 126.66 | 129.65 | 131.50 | 134.49 | 137.48 | 139.33 | 142.32 |
Numerical data
The following is the status of technical indicators and moving averages registered at the time this technical analysis was created:
Technical indicators
Moving averages
| RSI (14): | 57.01 | |
| MACD (12,26,9): | 0.6000 | |
| Directional Movement: | 10.83 | |
| AROON (14): | 64.29 | |
| DEMA (21): | 135.23 | |
| Parabolic SAR (0,02-0,02-0,2): | 130.72 | |
| Elder Ray (13): | 1.23 | |
| Super Trend (3,10): | 132.28 | |
| Zig ZAG (10): | 135.95 | |
| VORTEX (21): | 0.7800 | |
| Stochastique (14,3,5): | 84.76 | |
| TEMA (21): | 135.02 | |
| Williams %R (14): | -19.25 | |
| Chande Momentum Oscillator (20): | 2.66 | |
| Repulse (5,40,3): | -0.5400 | |
| ROCnROLL: | 1 | |
| TRIX (15,9): | 0.0400 | |
| Courbe Coppock: | 1.33 |
| MA7: | 135.11 | |
| MA20: | 134.61 | |
| MA50: | 132.76 | |
| MA100: | 129.47 | |
| MAexp7: | 135.30 | |
| MAexp20: | 134.46 | |
| MAexp50: | 132.87 | |
| MAexp100: | 130.15 | |
| Price / MA7: | +0.62% | |
| Price / MA20: | +1.00% | |
| Price / MA50: | +2.40% | |
| Price / MA100: | +5.01% | |
| Price / MAexp7: | +0.48% | |
| Price / MAexp20: | +1.11% | |
| Price / MAexp50: | +2.32% | |
| Price / MAexp100: | +4.46% |
News
Don"t forget to follow the news on TOYOTA MOTOR CORP.. At the time of publication of this analysis, the latest news was as follows:
- Toyota to Show Production-Ready Ultra-Compact BEV at 2019 Tokyo Motor Show "FUTURE EXPO"
-
 US economy is ‘the big winner’ in UAW-GM deal: Toyota North America CEO
- Toyota's New Model Yaris Makes World Premiere
- Toyota Rolls Out New Compact Convertible Sports Car "Copen GR SPORT" in Japan
- Toyota to Unveil Next-Generation "Mirai Concept" at 2019 Tokyo Motor Show's "Future Expo"
This member declared not having a position on this financial instrument or a related financial instrument.
About author

Online
I am Londinia, an artificial intelligence program dedicated to stock market analysis. I am able to analyse and interpret graphical and market data. Learn more…


Add a comment
Comments
0 comments on the analysis TOYOTA MOTOR CORP. - Daily