TRACTOR SUPPLY CO. - Daily - Technical analysis published on 03/22/2021 (GMT)
- 306
- 0
Click here for a new analysis!
- Timeframe : Daily
- - Analysis generated on
- Status : TARGET REACHED
Summary of the analysis

Additional analysis
Quotes
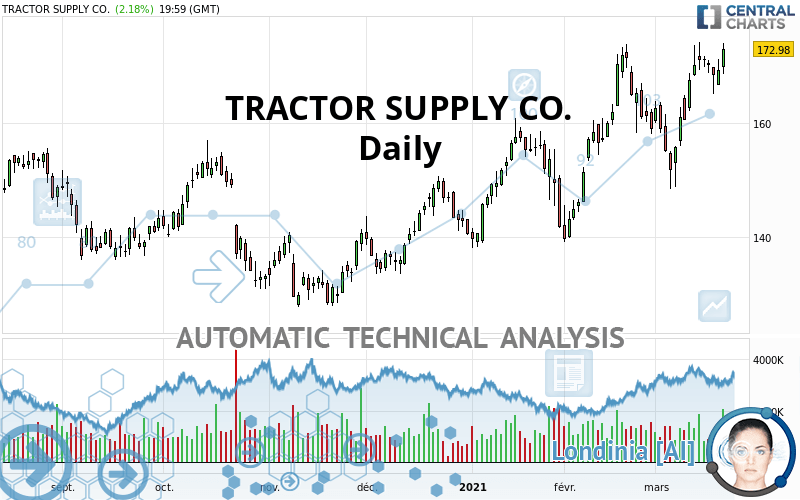
The TRACTOR SUPPLY CO. price is 172.98 USD. The price registered an increase of +2.18% on the session and was between 168.62 USD and 174.08 USD. This implies that the price is at +2.59% from its lowest and at -0.63% from its highest.A bullish opening was detected by the Central Gaps scanner. Buyers are trying to impose a bullish momentum in the very short term.
Bullish opening
Type : Bullish
Timeframe : Openning
So that you have an overall view of the price change, here is a table showing the variations over several periods:
Near a new HIGH record (1 year)
Type : Bullish
Timeframe : Weekly
Near a new HIGH record (1st january)
Type : Bullish
Timeframe : Weekly
Near a new HIGH record (1 month)
Type : Bullish
Timeframe : Weekly
Technical
Technical analysis of this Daily chart of TRACTOR SUPPLY CO. indicates that the overall trend is strongly bullish. 92.86% of the signals given by moving averages are bullish. This strongly bullish trend is supported by the strong bullish signals given by short-term moving averages. The Central Indicators scanner does not detect any result on moving averages that would impact this trend.
An assessment of technical indicators shows a strong bullish signal.
Caution: the Central Indicators scanner currently detects an excess:
CCI indicator: bearish divergence
Type : Bearish
Timeframe : Daily
MACD indicator: bearish divergence
Type : Bearish
Timeframe : Daily
Williams %R indicator is overbought : over -20
Type : Neutral
Timeframe : Daily
Pivot points : price is over resistance 2
Type : Neutral
Timeframe : Daily
Pivot points : price is over resistance 2
Type : Neutral
Timeframe : Weekly
Pivot points : price is under support 3
Type : Neutral
Timeframe : Daily
Price is back under the pivot point
Type : Bearish
Timeframe : Weekly
An analysis of the price chart with the Central Patterns scanner (detector of chart patterns and resistances and supports) shows several results that can have an impact on the price change:
Near resistance of channel
Type : Bearish
Timeframe : Daily
Horizontal resistance is broken
Type : Bullish
Timeframe : Daily
The Central Candlesticks scanner which studies Japanese candlesticks did not detect anything.
| S3 | S2 | S1 | Price | |
|---|---|---|---|---|
| ProTrendLines | 136.95 | 154.63 | 171.89 | 172.98 |
| Change (%) | -20.83% | -10.61% | -0.63% | - |
| Change | -36.03 | -18.35 | -1.09 | - |
| Level | Intermediate | Major | Major | - |
Attention could also be paid to pivot points to set price objectives:
| Pivot points | S3 | S2 | S1 | PP | R1 | R2 | R3 |
|---|---|---|---|---|---|---|---|
| Standard | 164.17 | 166.40 | 169.63 | 171.86 | 175.09 | 177.32 | 180.55 |
| Camarilla | 171.37 | 171.87 | 172.37 | 172.87 | 173.37 | 173.87 | 174.37 |
| Woodie | 164.68 | 166.65 | 170.14 | 172.11 | 175.60 | 177.57 | 181.06 |
| Fibonacci | 166.40 | 168.48 | 169.77 | 171.86 | 173.94 | 175.23 | 177.32 |
| Pivot points | S3 | S2 | S1 | PP | R1 | R2 | R3 |
|---|---|---|---|---|---|---|---|
| Standard | 158.31 | 161.70 | 167.29 | 170.68 | 176.27 | 179.66 | 185.25 |
| Camarilla | 170.40 | 171.22 | 172.05 | 172.87 | 173.69 | 174.52 | 175.34 |
| Woodie | 159.40 | 162.25 | 168.38 | 171.23 | 177.36 | 180.21 | 186.34 |
| Fibonacci | 161.70 | 165.13 | 167.25 | 170.68 | 174.11 | 176.23 | 179.66 |
| Pivot points | S3 | S2 | S1 | PP | R1 | R2 | R3 |
|---|---|---|---|---|---|---|---|
| Standard | 105.43 | 122.05 | 140.51 | 157.13 | 175.59 | 192.21 | 210.67 |
| Camarilla | 149.31 | 152.53 | 155.74 | 158.96 | 162.18 | 165.39 | 168.61 |
| Woodie | 106.34 | 122.51 | 141.42 | 157.59 | 176.50 | 192.67 | 211.58 |
| Fibonacci | 122.05 | 135.45 | 143.73 | 157.13 | 170.53 | 178.81 | 192.21 |
Numerical data
The following are the details of the technical indicators and moving averages that were collected to generate this technical analysis:
| RSI (14): | 64.77 | |
| MACD (12,26,9): | 3.9100 | |
| Directional Movement: | 9.74 | |
| AROON (14): | 42.86 | |
| DEMA (21): | 169.96 | |
| Parabolic SAR (0,02-0,02-0,2): | 156.31 | |
| Elder Ray (13): | 4.32 | |
| Super Trend (3,10): | 155.95 | |
| Zig ZAG (10): | 172.87 | |
| VORTEX (21): | 0.9700 | |
| Stochastique (14,3,5): | 84.48 | |
| TEMA (21): | 170.91 | |
| Williams %R (14): | -5.09 | |
| Chande Momentum Oscillator (20): | 17.79 | |
| Repulse (5,40,3): | 3.4900 | |
| ROCnROLL: | 1 | |
| TRIX (15,9): | 0.2900 | |
| Courbe Coppock: | 11.11 |
| MA7: | 170.43 | |
| MA20: | 163.88 | |
| MA50: | 157.91 | |
| MA100: | 147.47 | |
| MAexp7: | 169.33 | |
| MAexp20: | 164.99 | |
| MAexp50: | 158.47 | |
| MAexp100: | 151.43 | |
| Price / MA7: | +1.50% | |
| Price / MA20: | +5.55% | |
| Price / MA50: | +9.54% | |
| Price / MA100: | +17.30% | |
| Price / MAexp7: | +2.16% | |
| Price / MAexp20: | +4.84% | |
| Price / MAexp50: | +9.16% | |
| Price / MAexp100: | +14.23% |
News
The last news published on TRACTOR SUPPLY CO. at the time of the generation of this analysis was as follows:
- Tractor Supply Company Raises $790,269 for Grants for Growing Program
- Miranda Lambert’s MuttNation & Tractor Supply Co. Donate $250,000 to Animal Shelters
- Tractor Supply Supports Texas in Winter Storm Recovery
- Tractor Supply Company to Participate in Bank of America Securities 2021 Consumer and Retail Investment Conference
- Tractor Supply Announces Annual Grants for Growing Fundraiser in Support of FFA
About author

Online


Add a comment
Comments
0 comments on the analysis TRACTOR SUPPLY CO. - Daily