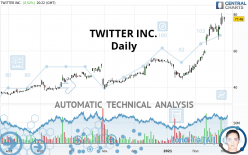
TWITTER INC. - Daily - Technical analysis published on 03/01/2021 (GMT)
- 177
- 0
Click here for a new analysis!
- Timeframe : Daily
- - Analysis generated on
- Status : INVALID

Summary of the analysis
Additional analysis
Quotes
The TWITTER INC. price is 77.46 USD. The price registered an increase of +0.52% on the session and was between 76.05 USD and 78.73 USD. This implies that the price is at +1.85% from its lowest and at -1.61% from its highest.The Central Gaps scanner detects a bullish opening marking the presence of buyers ahead of sellers at the opening but not sufficiently marked to allow the price to register a quotation gap.
Bullish opening
Type : Bullish
Timeframe : Openning
Here is a more detailed summary of the historical variations registered by TWITTER INC.:
Near a new HIGH record (1 year)
Type : Bullish
Timeframe : Weekly
Near a new HIGH record (1st january)
Type : Bullish
Timeframe : Weekly
Near a new HIGH record (1 month)
Type : Bullish
Timeframe : Weekly
Technical
A technical analysis in Daily of this TWITTER INC. chart shows a strongly bullish trend. The signals given by the moving averages are 92.86% bullish. This strong bullish trend is confirmed by the strong signals currently being given by short-term moving averages. There is no crossing of moving average by the price or crossing of moving averages between themselves.
An assessment of technical indicators shows a strong bullish signal.
Caution: the Central Indicators scanner currently detects an excess:
RSI indicator is overbought : over 70
Type : Neutral
Timeframe : Daily
Williams %R indicator is overbought : over -20
Type : Neutral
Timeframe : Daily
Price is back over the pivot point
Type : Bullish
Timeframe : Daily
Price is back over the pivot point
Type : Bullish
Timeframe : Weekly
An analysis of the price chart with the Central Patterns scanner (detector of chart patterns and resistances and supports) shows several results that can have an impact on the price change:
Near resistance of channel
Type : Bearish
Timeframe : Daily
Near horizontal support
Type : Bullish
Timeframe : Daily
Central Candlesticks, the scanner specialised in Japanese candlesticks, detects these signals that could have an impact on the current short-term trend:
Bullish harami
Type : Bullish
Timeframe : Daily
Doji
Type : Neutral
Timeframe : Daily
| S3 | S2 | S1 | Price | |
|---|---|---|---|---|
| ProTrendLines | 45.34 | 55.87 | 73.96 | 77.46 |
| Change (%) | -41.47% | -27.87% | -4.52% | - |
| Change | -32.12 | -21.59 | -3.50 | - |
| Level | Major | Major | Intermediate | - |
Attention could also be paid to pivot points to set price objectives:
| Pivot points | S3 | S2 | S1 | PP | R1 | R2 | R3 |
|---|---|---|---|---|---|---|---|
| Standard | 70.93 | 72.97 | 75.01 | 77.05 | 79.09 | 81.13 | 83.17 |
| Camarilla | 75.94 | 76.31 | 76.69 | 77.06 | 77.43 | 77.81 | 78.18 |
| Woodie | 70.94 | 72.97 | 75.02 | 77.05 | 79.10 | 81.13 | 83.18 |
| Fibonacci | 72.97 | 74.53 | 75.49 | 77.05 | 78.61 | 79.57 | 81.13 |
| Pivot points | S3 | S2 | S1 | PP | R1 | R2 | R3 |
|---|---|---|---|---|---|---|---|
| Standard | 54.02 | 60.11 | 68.58 | 74.67 | 83.14 | 89.23 | 97.70 |
| Camarilla | 73.06 | 74.39 | 75.73 | 77.06 | 78.40 | 79.73 | 81.06 |
| Woodie | 55.22 | 60.71 | 69.78 | 75.27 | 84.34 | 89.83 | 98.90 |
| Fibonacci | 60.11 | 65.67 | 69.11 | 74.67 | 80.23 | 83.67 | 89.23 |
| Pivot points | S3 | S2 | S1 | PP | R1 | R2 | R3 |
|---|---|---|---|---|---|---|---|
| Standard | 28.83 | 39.95 | 58.51 | 69.63 | 88.18 | 99.31 | 117.86 |
| Camarilla | 68.90 | 71.62 | 74.34 | 77.06 | 79.78 | 82.50 | 85.22 |
| Woodie | 32.54 | 41.81 | 62.22 | 71.49 | 91.90 | 101.16 | 121.58 |
| Fibonacci | 39.95 | 51.29 | 58.29 | 69.63 | 80.96 | 87.97 | 99.31 |
Numerical data
The following are the details of the technical indicators and moving averages that were collected to generate this technical analysis:
| RSI (14): | 77.99 | |
| MACD (12,26,9): | 6.1100 | |
| Directional Movement: | 22.73 | |
| AROON (14): | 85.71 | |
| DEMA (21): | 75.54 | |
| Parabolic SAR (0,02-0,02-0,2): | 66.77 | |
| Elder Ray (13): | 6.28 | |
| Super Trend (3,10): | 65.50 | |
| Zig ZAG (10): | 77.02 | |
| VORTEX (21): | 1.2400 | |
| Stochastique (14,3,5): | 81.44 | |
| TEMA (21): | 78.48 | |
| Williams %R (14): | -16.17 | |
| Chande Momentum Oscillator (20): | 9.39 | |
| Repulse (5,40,3): | -4.3000 | |
| ROCnROLL: | 1 | |
| TRIX (15,9): | 1.4400 | |
| Courbe Coppock: | 58.27 |
| MA7: | 73.83 | |
| MA20: | 66.78 | |
| MA50: | 57.41 | |
| MA100: | 51.85 | |
| MAexp7: | 74.25 | |
| MAexp20: | 67.79 | |
| MAexp50: | 59.73 | |
| MAexp100: | 53.56 | |
| Price / MA7: | +4.92% | |
| Price / MA20: | +15.99% | |
| Price / MA50: | +34.92% | |
| Price / MA100: | +49.39% | |
| Price / MAexp7: | +4.32% | |
| Price / MAexp20: | +14.26% | |
| Price / MAexp50: | +29.68% | |
| Price / MAexp100: | +44.62% |
News
The last news published on TWITTER INC. at the time of the generation of this analysis was as follows:
-
 Trump puts end to rumors of new political party, talks life without Twitter
-
LIVE | Twitter Spaces, Salesforce, DoorDash, Airbnb: Jim Cramer's Stock Market Breakdown - Feb. 26
-
Twitter, Inc. - TWTR Stock Chart Technical Analysis for 02-25-2021
- Should you invest in Bank of America, Carnival Corp, Twitter, Fisker, or Plug Power?
- Should you invest in Apple, Tilray, General Electric, Bank of America, or Twitter?
About author

Online


Add a comment
Comments
0 comments on the analysis TWITTER INC. - Daily