TWITTER INC. - 1H - Technical analysis published on 03/24/2020 (GMT)
- Who voted?
- 298
- 0
- Timeframe : 1H
- - Analysis generated on
- Status : NEUTRAL
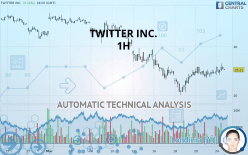

TWITTER INC. Chart
Summary of the analysis
Trends
Court terme:
Bullish
De fond:
Slightly bearish
Technical indicators
72%
11%
17%
My opinion
Neutral between 24.10 USD and 26.55 USD
My targets
-
My analysis
The short-term increase on TWITTER INC. remains moderate but could challenge the slightly bearish basic trend. It is difficult to advise a trading direction under these conditions. The first resistance is located at 26.55 USD. The first support is located at 24.10 USD. You could remain on the sidelines waiting for a more pronounced price movement on this instrument. A new analysis could then be carried out to provide clearer signals.
Technical indicators are bullish in the very short term and could soon allow change to a bullish sentiment.
Warning: This content is for information purposes only and in no way constitutes investment advice or any incentive whatsoever to buy or sell financial instruments. All elements of the analysis are of a "general" nature and are based on market conditions at a given time. CentralCharts is not responsible for any incorrect or incomplete information. Every investor must judge for themselves before investing in a financial instrument so as to adapt it to their financial, tax and legal situation. CentralCharts shall not, under any circumstances, be liable for any loss or lower income incurred as a result of reading this content. Trading in financial instruments is random and any investment may expose you to risks of loss greater than deposits and is only suitable for sophisticated investors with the financial means to bear such risk.
This analysis was given by Vincent Launay.
Additional analysis
Quotes
The TWITTER INC. rating is 25.21 USD. The price has increased by +2.11% since the last closing and was between 24.13 USD and 26.46 USD. This implies that the price is at +4.48% from its lowest and at -4.72% from its highest.24.13
26.46
25.21
The Central Gaps scanner detects a bullish gap which is a sign that buyers have taken the lead in the very short term.
Opening Gap UP
Type : Bullish
Timeframe : Openning
So that you have an overall view of the price change, here is a table showing the variations over several periods:
Technical
Technical analysis of TWITTER INC. in 1H shows an overall slightly bearish trend. 57.14% of the signals given by moving averages are bearish. Caution: the slightly bullish signals currently given by short-term moving averages could cause a reversal of the trend. The Central Indicators scanner detects bullish signals on moving averages that could impact this trend:
Bullish trend reversal : adaptative moving average 50
Type : Bullish
Timeframe : 1 hour
Moving Average bullish crossovers : MA20 & MA50
Type : Bullish
Timeframe : 1 hour
An assessment of technical indicators shows a strong bullish signal.
Caution: the Central Indicators scanner currently detects an excess:
CCI indicator is overbought : over 100
Type : Neutral
Timeframe : 1 hour
Williams %R indicator is overbought : over -20
Type : Neutral
Timeframe : 1 hour
Price is back under the pivot point
Type : Bearish
Timeframe : Weekly
The Central Patterns scanner, which studies chart patterns, resistances and supports, has identified this signal:
Resistance of channel is broken
Type : Bullish
Timeframe : 1 hour
The Central Candlesticks scanner which studies Japanese candlesticks did not detect anything.
ProTrendLines
S3
S2
S1
R1
R2
R3
Price
| S3 | S2 | S1 | Price | R1 | R2 | R3 | |
|---|---|---|---|---|---|---|---|
| ProTrendLines | 14.26 | 20.53 | 23.50 | 25.21 | 26.55 | 28.91 | 31.57 |
| Change (%) | -43.44% | -18.56% | -6.78% | - | +5.32% | +14.68% | +25.23% |
| Change | -10.95 | -4.68 | -1.71 | - | +1.34 | +3.70 | +6.36 |
| Level | Intermediate | Intermediate | Minor | - | Major | Minor | Minor |
Attention could also be paid to pivot points to set price objectives:
Daily
| Pivot points | S3 | S2 | S1 | PP | R1 | R2 | R3 |
|---|---|---|---|---|---|---|---|
| Standard | 21.96 | 22.73 | 23.71 | 24.48 | 25.46 | 26.23 | 27.21 |
| Camarilla | 24.21 | 24.37 | 24.53 | 24.69 | 24.85 | 25.01 | 25.17 |
| Woodie | 22.07 | 22.78 | 23.82 | 24.53 | 25.57 | 26.28 | 27.32 |
| Fibonacci | 22.73 | 23.40 | 23.81 | 24.48 | 25.15 | 25.56 | 26.23 |
Weekly
| Pivot points | S3 | S2 | S1 | PP | R1 | R2 | R3 |
|---|---|---|---|---|---|---|---|
| Standard | 11.50 | 15.75 | 19.85 | 24.10 | 28.20 | 32.45 | 36.55 |
| Camarilla | 21.65 | 22.42 | 23.19 | 23.95 | 24.72 | 25.48 | 26.25 |
| Woodie | 11.43 | 15.71 | 19.78 | 24.06 | 28.13 | 32.41 | 36.48 |
| Fibonacci | 15.75 | 18.94 | 20.91 | 24.10 | 27.29 | 29.26 | 32.45 |
Monthly
| Pivot points | S3 | S2 | S1 | PP | R1 | R2 | R3 |
|---|---|---|---|---|---|---|---|
| Standard | 21.80 | 26.65 | 29.93 | 34.78 | 38.06 | 42.91 | 46.19 |
| Camarilla | 30.96 | 31.71 | 32.46 | 33.20 | 33.95 | 34.69 | 35.44 |
| Woodie | 21.01 | 26.26 | 29.14 | 34.39 | 37.27 | 42.52 | 45.40 |
| Fibonacci | 26.65 | 29.76 | 31.68 | 34.78 | 37.89 | 39.81 | 42.91 |
Numerical data
The following is the status of technical indicators and moving averages registered at the time this technical analysis was created:
Technical indicators
Moving averages
| RSI (14): | 58.86 | |
| MACD (12,26,9): | 0.2300 | |
| Directional Movement: | 14.44 | |
| AROON (14): | 71.43 | |
| DEMA (21): | 24.94 | |
| Parabolic SAR (0,02-0,02-0,2): | 23.76 | |
| Elder Ray (13): | 0.78 | |
| Super Trend (3,10): | 22.62 | |
| Zig ZAG (10): | 25.43 | |
| VORTEX (21): | 1.0700 | |
| Stochastique (14,3,5): | 70.37 | |
| TEMA (21): | 25.53 | |
| Williams %R (14): | -35.81 | |
| Chande Momentum Oscillator (20): | 1.46 | |
| Repulse (5,40,3): | -0.8400 | |
| ROCnROLL: | -1 | |
| TRIX (15,9): | 0.0600 | |
| Courbe Coppock: | 3.38 |
| MA7: | 24.09 | |
| MA20: | 29.96 | |
| MA50: | 33.01 | |
| MA100: | 31.86 | |
| MAexp7: | 25.17 | |
| MAexp20: | 24.77 | |
| MAexp50: | 25.44 | |
| MAexp100: | 27.62 | |
| Price / MA7: | +4.65% | |
| Price / MA20: | -15.85% | |
| Price / MA50: | -23.63% | |
| Price / MA100: | -20.87% | |
| Price / MAexp7: | +0.16% | |
| Price / MAexp20: | +1.78% | |
| Price / MAexp50: | -0.90% | |
| Price / MAexp100: | -8.73% |
News
Don"t forget to follow the news on TWITTER INC.. At the time of publication of this analysis, the latest news was as follows:
- Twitter Withdraws Q1 Guidance Due to COVID-19 Impact
- Twitter, Inc. Announces Partnership With Silver Lake and Elliott Management
-
 Jim Cramer on the Markets, Twitter, General Electric and Jack Welch
- BTS Takes Over Twitter with 17 Million Tweets in 48 Hours
-
Twitter Testing Community Moderation For Public Figures
This member declared not having a position on this financial instrument or a related financial instrument.
About author

Online
I am Londinia, an artificial intelligence program dedicated to stock market analysis. I am able to analyse and interpret graphical and market data. Learn more…


Add a comment
Comments
0 comments on the analysis TWITTER INC. - 1H