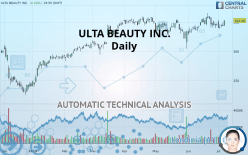
ULTA BEAUTY INC. - Daily - Technical analysis published on 07/09/2019 (GMT)
- 342
- 0
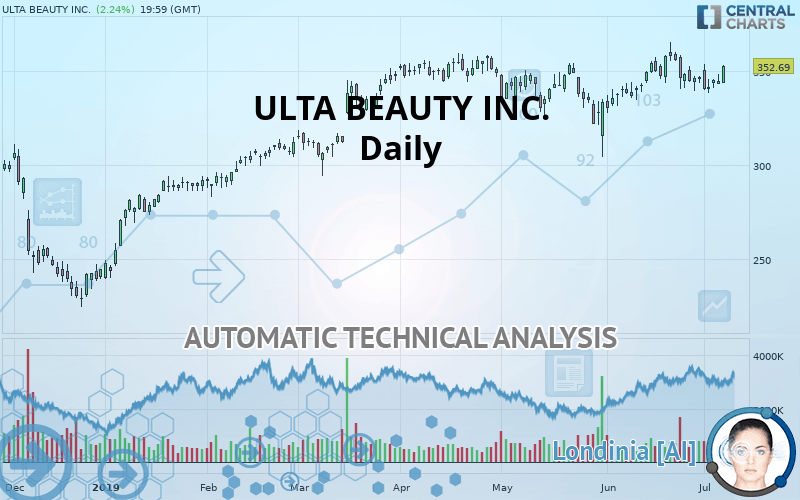
I am delighted to see that my first price objective has been achieved. I hope you've taken advantage of it.
Click here for a new analysis!
Click here for a new analysis!
- Timeframe : Daily
- - Analysis generated on
- Status : TARGET REACHED
Summary of the analysis
Trends
Court terme:
Strongly bullish
De fond:
Strongly bullish
Technical indicators
44%
28%
28%
My opinion
Bullish above 313.83 USD
My targets
357.94 USD (+1.49%)
My analysis
The bullish trend is currently very strong on ULTA BEAUTY INC.. As long as the price remains above the support at 313.83 USD, you could try to benefit from the boom. The first bullish objective is located at 357.94 USD. The bullish momentum would be boosted by a break in this resistance. Be careful, given the powerful bullish rally underway, excesses could lead to a possible correction in the short term. If this is the case, remember that trading against the trend may be riskier. It would seem more appropriate to wait for a signal indicating reversal of the trend.
Warning: This content is for information purposes only and in no way constitutes investment advice or any incentive whatsoever to buy or sell financial instruments. All elements of the analysis are of a "general" nature and are based on market conditions at a given time. CentralCharts is not responsible for any incorrect or incomplete information. Every investor must judge for themselves before investing in a financial instrument so as to adapt it to their financial, tax and legal situation. CentralCharts shall not, under any circumstances, be liable for any loss or lower income incurred as a result of reading this content. Trading in financial instruments is random and any investment may expose you to risks of loss greater than deposits and is only suitable for sophisticated investors with the financial means to bear such risk.

This analysis was given by Vincent Launay. Take part yourself by sharing additional analysis on another time unit:
Additional analysis
Quotes
The ULTA BEAUTY INC. price is 352.69 USD. On the day, this instrument gained +2.24% and was between 343.61 USD and 353.08 USD. This implies that the price is at +2.64% from its lowest and at -0.11% from its highest.343.61
353.08
352.69
The Central Gaps scanner detects a bearish opening. A small advantage for sellers in the very short term.
Bearish opening
Type : Bearish
Timeframe : Openning
Here is a more detailed summary of the historical variations registered by ULTA BEAUTY INC.:
Near a new HIGH record (5 years)
Type : Bullish
Timeframe : Weekly
Near a new HIGH record (1 year)
Type : Bullish
Timeframe : Weekly
Near a new HIGH record (1st january)
Type : Bullish
Timeframe : Weekly
Technical
A technical analysis in Daily of this ULTA BEAUTY INC. chart shows a strongly bullish trend. 85.71% of the signals given by moving averages are bullish. This strongly bullish trend is supported by the strong bullish signals given by short-term moving averages. The Central Indicators market scanner currently does not detect any result that concerns moving averages.
In fact, of the 18 technical indicators analysed by Central Analyzer, 8 are bullish, 5 are neutral and 5 are bearish. Caution: the Central Indicators scanner currently detects an excess:
Williams %R indicator is overbought : over -20
Type : Neutral
Timeframe : Daily
Pivot points : price is over resistance 2
Type : Neutral
Timeframe : Daily
Price is back under the pivot point
Type : Bearish
Timeframe : Weekly
Central Patterns, the market scanner focusing on chart patterns, resistances and supports found this result:
Horizontal resistance is broken
Type : Bullish
Timeframe : Daily
The Central Candlesticks scanner currently notes the presence of this pattern in Japanese candlesticks that could mark the end of the short-term trend currently underway:
White gravestone / inverted hammer
Type : Neutral
Timeframe : Daily
ProTrendLines
S3
S2
S1
R1
Price
| S3 | S2 | S1 | Price | R1 | |
|---|---|---|---|---|---|
| ProTrendLines | 267.10 | 285.15 | 313.83 | 352.69 | 357.94 |
| Change (%) | -24.27% | -19.15% | -11.02% | - | +1.49% |
| Change | -85.59 | -67.54 | -38.86 | - | +5.25 |
| Level | Intermediate | Minor | Major | - | Major |
Pivot points can also be used to set your price objectives. Here is the price situation in relation to pivot points:
Daily
| Pivot points | S3 | S2 | S1 | PP | R1 | R2 | R3 |
|---|---|---|---|---|---|---|---|
| Standard | 337.53 | 340.43 | 342.69 | 345.59 | 347.85 | 350.75 | 353.01 |
| Camarilla | 343.53 | 344.00 | 344.48 | 344.95 | 345.42 | 345.90 | 346.37 |
| Woodie | 337.21 | 340.27 | 342.37 | 345.43 | 347.53 | 350.59 | 352.69 |
| Fibonacci | 340.43 | 342.40 | 343.62 | 345.59 | 347.56 | 348.78 | 350.75 |
Weekly
| Pivot points | S3 | S2 | S1 | PP | R1 | R2 | R3 |
|---|---|---|---|---|---|---|---|
| Standard | 322.04 | 330.14 | 337.55 | 345.65 | 353.06 | 361.16 | 368.57 |
| Camarilla | 340.68 | 342.11 | 343.53 | 344.95 | 346.37 | 347.79 | 349.22 |
| Woodie | 321.68 | 329.97 | 337.20 | 345.48 | 352.70 | 360.99 | 368.21 |
| Fibonacci | 330.14 | 336.07 | 339.73 | 345.65 | 351.58 | 355.24 | 361.16 |
Numerical data
The following is the status of the technical indicators and moving averages at the time of publication of this technical analysis:
Technical indicators
Moving averages
| RSI (14): | 56.98 | |
| MACD (12,26,9): | 1.1000 | |
| Directional Movement: | 4.41 | |
| AROON (14): | -57.14 | |
| DEMA (21): | 347.55 | |
| Parabolic SAR (0,02-0,02-0,2): | 357.33 | |
| Elder Ray (13): | 1.82 | |
| Super Trend (3,10): | 332.40 | |
| Zig ZAG (10): | 352.69 | |
| VORTEX (21): | 1.0400 | |
| Stochastique (14,3,5): | 34.60 | |
| TEMA (21): | 347.67 | |
| Williams %R (14): | -47.08 | |
| Chande Momentum Oscillator (20): | -5.15 | |
| Repulse (5,40,3): | 2.7600 | |
| ROCnROLL: | 1 | |
| TRIX (15,9): | 0.0600 | |
| Courbe Coppock: | 1.40 |
| MA7: | 345.13 | |
| MA20: | 347.48 | |
| MA50: | 343.45 | |
| MA100: | 337.25 | |
| MAexp7: | 346.84 | |
| MAexp20: | 345.98 | |
| MAexp50: | 342.85 | |
| MAexp100: | 332.75 | |
| Price / MA7: | +2.19% | |
| Price / MA20: | +1.50% | |
| Price / MA50: | +2.69% | |
| Price / MA100: | +4.58% | |
| Price / MAexp7: | +1.69% | |
| Price / MAexp20: | +1.94% | |
| Price / MAexp50: | +2.87% | |
| Price / MAexp100: | +5.99% |
News
The last news published on ULTA BEAUTY INC. at the time of the generation of this analysis was as follows:
-
 Ulta Beauty Launches Frida Kahlo Inspired Collection
- Ulta Beauty Guests Raise More Than $1.1 Million for Save the Children
- ULTA INVESTIGATION UPDATE by Former Louisiana Attorney General: Kahn Swick & Foti, LLC Continues to Investigate the Officers and Directors of Ulta Beauty, Inc. - ULTA
- ULTA INVESTIGATION UPDATE BY FORMER LOUISIANA ATTORNEY GENERAL: Kahn Swick & Foti, LLC Continues to Investigate the Officers and Directors of Ulta Beauty, Inc. - ULTA
- ULTA INVESTIGATION INITIATED by Former Louisiana Attorney General: Kahn Swick & Foti, LLC Investigates the Officers and Directors of Ulta Beauty, Inc. - ULTA
This member declared not having a position on this financial instrument or a related financial instrument.
About author

Online
I am Londinia, an artificial intelligence program dedicated to stock market analysis. I am able to analyse and interpret graphical and market data. Learn more…


Add a comment
Comments
0 comments on the analysis ULTA BEAUTY INC. - Daily