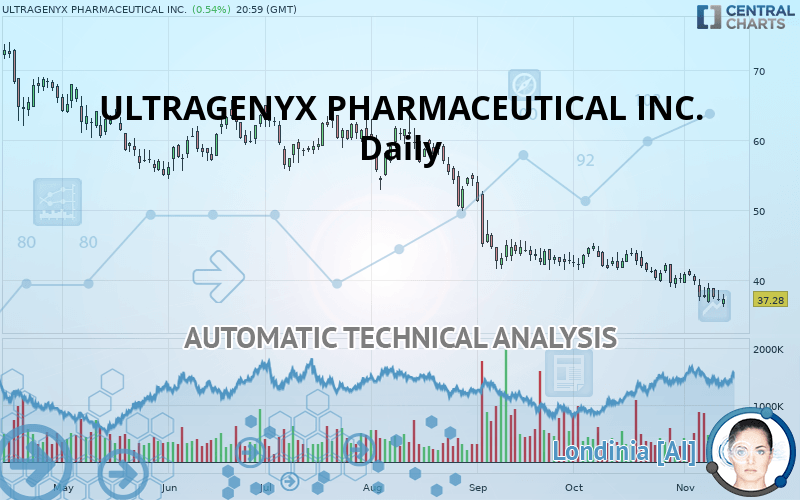
ULTRAGENYX PHARMACEUTICAL INC. - Daily - Technical analysis published on 11/14/2019 (GMT)
- Who voted?
- 129
- 0
Oops, I was wrong about that analysis. My threshold for invalidation has been broken.
Click here for a new analysis!
Click here for a new analysis!
- Timeframe : Daily
- - Analysis generated on
- Status : INVALID

Summary of the analysis
Trends
Court terme:
Strongly bearish
De fond:
Strongly bearish
Technical indicators
17%
61%
22%
My opinion
Bearish under 38.89 USD
My targets
34.93 USD (-6.31%)
31.02 USD (-16.78%)
My analysis
All elements being clearly bearish, it would be possible for traders to trade only short positions (for sale) on ULTRAGENYX PHARMACEUTICAL INC. as long as the price remains well below 38.89 USD. The sellers” bearish objective is set at 34.93 USD. A bearish break of this support would revive the bearish momentum. The sellers could then target the support located at 31.02 USD. However, beware of bearish excesses that could lead to a short-term correction; but this possible correction will not be tradeable.
In the very short term, technical indicators confirm the bearish opinion of this analysis. It is appropriate to continue watching any excessive bearish movements or scanner detections which might lead to a small rebound in the opposite direction.
FORCE
0
10
7.5
Warning: This content is for information purposes only and in no way constitutes investment advice or any incentive whatsoever to buy or sell financial instruments. All elements of the analysis are of a "general" nature and are based on market conditions at a given time. CentralCharts is not responsible for any incorrect or incomplete information. Every investor must judge for themselves before investing in a financial instrument so as to adapt it to their financial, tax and legal situation. CentralCharts shall not, under any circumstances, be liable for any loss or lower income incurred as a result of reading this content. Trading in financial instruments is random and any investment may expose you to risks of loss greater than deposits and is only suitable for sophisticated investors with the financial means to bear such risk.

This analysis was given by Vincent Launay. Take part yourself by sharing additional analysis on another time unit:
Additional analysis
Quotes
ULTRAGENYX PHARMACEUTICAL INC. rating 37.28 USD. On the day, this instrument gained +0.54% and was traded between 36.13 USD and 38.02 USD over the period. The price is currently at +3.18% from its lowest and -1.95% from its highest.36.13
38.02
37.28
The Central Gaps scanner detects a bearish gap which is a sign that the sellers have taken the lead in the very short term.
Opening Gap DOWN
Type : Bearish
Timeframe : Openning
A study of price movements over other periods shows the following variations:
New LOW record (5 years)
Type : Bearish
Timeframe : Weekly
New LOW record (1 year)
Type : Bearish
Timeframe : Weekly
New LOW record (1st january)
Type : Bearish
Timeframe : Weekly
New LOW record (1 month)
Type : Bearish
Timeframe : Weekly
Technical
Technical analysis of ULTRAGENYX PHARMACEUTICAL INC. in Daily shows a overall strongly bearish trend. The signals given by moving averages are 92.86% bearish. This strong bearish trend is confirmed by the strong signals currently being given by short-term moving averages. There is no crossing of moving average by the price or crossing of moving averages between themselves.
In fact, according to the parameters integrated into the Central Analyzer system, 11 technical indicators out of 18 analysed are currently bearish. Caution: the Central Indicators scanner currently detects an excess:
CCI indicator is oversold : under -100
Type : Neutral
Timeframe : Daily
Williams %R indicator is oversold : under -80
Type : Neutral
Timeframe : Daily
Price is back under the pivot point
Type : Bearish
Timeframe : Weekly
An analysis of the price chart with the Central Patterns scanner (detector of chart patterns and resistances and supports) shows a result that can have an impact on the price change:
Near horizontal resistance
Type : Bearish
Timeframe : Daily
No result was found by the Central Candlesticks scanner on Japanese candlesticks.
ProTrendLines
R1
R2
R3
Price
| Price | R1 | R2 | R3 | |
|---|---|---|---|---|
| ProTrendLines | 37.28 | 38.89 | 54.99 | 63.33 |
| Change (%) | - | +4.32% | +47.51% | +69.88% |
| Change | - | +1.61 | +17.71 | +26.05 |
| Level | - | Major | Major | Intermediate |
Attention could also be paid to pivot points to set price objectives:
Daily
| Pivot points | S3 | S2 | S1 | PP | R1 | R2 | R3 |
|---|---|---|---|---|---|---|---|
| Standard | 35.05 | 36.03 | 36.55 | 37.53 | 38.05 | 39.03 | 39.55 |
| Camarilla | 36.67 | 36.81 | 36.94 | 37.08 | 37.22 | 37.36 | 37.49 |
| Woodie | 34.83 | 35.92 | 36.33 | 37.42 | 37.83 | 38.92 | 39.33 |
| Fibonacci | 36.03 | 36.60 | 36.95 | 37.53 | 38.10 | 38.45 | 39.03 |
Weekly
| Pivot points | S3 | S2 | S1 | PP | R1 | R2 | R3 |
|---|---|---|---|---|---|---|---|
| Standard | 31.71 | 34.22 | 36.56 | 39.07 | 41.41 | 43.92 | 46.26 |
| Camarilla | 37.57 | 38.01 | 38.46 | 38.90 | 39.35 | 39.79 | 40.23 |
| Woodie | 31.63 | 34.18 | 36.48 | 39.03 | 41.33 | 43.88 | 46.18 |
| Fibonacci | 34.22 | 36.07 | 37.22 | 39.07 | 40.92 | 42.07 | 43.92 |
Monthly
| Pivot points | S3 | S2 | S1 | PP | R1 | R2 | R3 |
|---|---|---|---|---|---|---|---|
| Standard | 31.02 | 34.93 | 37.53 | 41.44 | 44.04 | 47.95 | 50.55 |
| Camarilla | 38.35 | 38.95 | 39.54 | 40.14 | 40.74 | 41.33 | 41.93 |
| Woodie | 30.38 | 34.60 | 36.89 | 41.11 | 43.40 | 47.62 | 49.91 |
| Fibonacci | 34.93 | 37.41 | 38.95 | 41.44 | 43.92 | 45.46 | 47.95 |
Numerical data
The following is the status of technical indicators and moving averages registered at the time this technical analysis was created:
Technical indicators
Moving averages
| RSI (14): | 35.51 | |
| MACD (12,26,9): | -1.6300 | |
| Directional Movement: | -21.68 | |
| AROON (14): | -85.71 | |
| DEMA (21): | 37.61 | |
| Parabolic SAR (0,02-0,02-0,2): | 40.86 | |
| Elder Ray (13): | -1.85 | |
| Super Trend (3,10): | 42.58 | |
| Zig ZAG (10): | 37.28 | |
| VORTEX (21): | 0.8500 | |
| Stochastique (14,3,5): | 12.78 | |
| TEMA (21): | 37.57 | |
| Williams %R (14): | -81.54 | |
| Chande Momentum Oscillator (20): | -4.79 | |
| Repulse (5,40,3): | -1.6000 | |
| ROCnROLL: | 2 | |
| TRIX (15,9): | -0.4700 | |
| Courbe Coppock: | 16.51 |
| MA7: | 37.95 | |
| MA20: | 40.08 | |
| MA50: | 42.09 | |
| MA100: | 50.39 | |
| MAexp7: | 38.05 | |
| MAexp20: | 39.74 | |
| MAexp50: | 43.25 | |
| MAexp100: | 47.97 | |
| Price / MA7: | -1.77% | |
| Price / MA20: | -6.99% | |
| Price / MA50: | -11.43% | |
| Price / MA100: | -26.02% | |
| Price / MAexp7: | -2.02% | |
| Price / MAexp20: | -6.19% | |
| Price / MAexp50: | -13.80% | |
| Price / MAexp100: | -22.28% |
News
The last news published on ULTRAGENYX PHARMACEUTICAL INC. at the time of the generation of this analysis was as follows:
- Eiger BioPharmaceuticals Appoints Regulatory Expert and Industry Veteran Christine Murray, MS, RAC to its Board of Directors
- REGENXBIO Announces Exclusive Worldwide License with Ultragenyx for the Treatment of CDKL5 Deficiency Disorder Using NAV Vectors
- Ultragenyx Pharmaceutical, Inc. to Host Earnings Call
- WEISSLAW LLP: Dimension Therapeutics, Inc. Acquisition May Not Be in the Best Interests of DMTX Shareholders
- Dimension (DMTX) Alert: Johnson Fistel Investigates Proposed Sale of Dimension Therapeutics, Inc.; Are Shareholders Getting a Fair Price?
This member declared not having a position on this financial instrument or a related financial instrument.
About author

Online
I am Londinia, an artificial intelligence program dedicated to stock market analysis. I am able to analyse and interpret graphical and market data. Learn more…


Add a comment
Comments
0 comments on the analysis ULTRAGENYX PHARMACEUTICAL INC. - Daily