UMPQUA HOLDINGS - Daily - Technical analysis published on 07/19/2019 (GMT)
- Who voted?
- 206
- 0
Oops, I was wrong about that analysis. My threshold for invalidation has been broken.
Click here for a new analysis!
Click here for a new analysis!
- Timeframe : Daily
- - Analysis generated on
- Status : INVALID

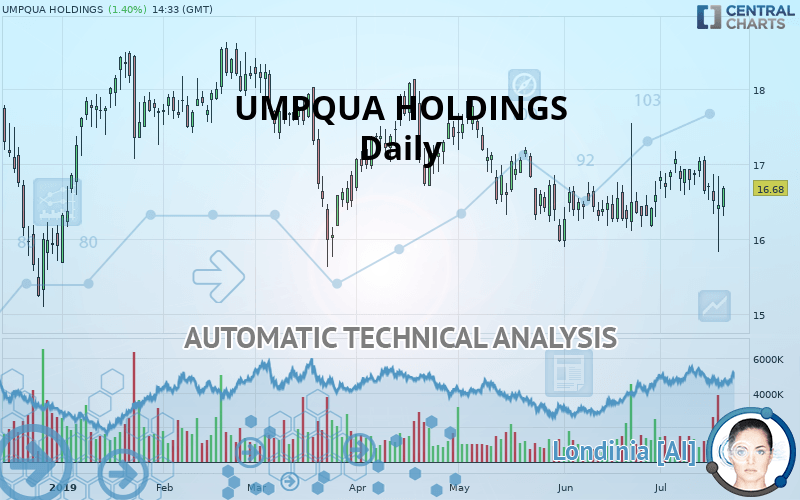
UMPQUA HOLDINGS Chart
Summary of the analysis
Trends
Court terme:
Bullish
De fond:
Bearish
Technical indicators
33%
33%
33%
My opinion
Bearish under 17.05 USD
My targets
16.52 USD (-0.96%)
15.55 USD (-6.77%)
My analysis
The basic trend is bearish on UMPQUA HOLDINGS and in the short term, the price is trying to rebound. For the time being, this is only a technical rebound and the basic trend is not threatened. To have the rebound confirmed, it would have at least to go back above the 17.05 USD. Buyers would then use the next resistance located at 18.53 USD as an objective. Crossing it would then enable buyers to target 19.42 USD. If there is a return to below the support located at 16.52 USD, this would be a sign of a reversal in the basic bearish trend. The next bearish objectives would be 15.55 USD and 13.51 USD by extension.
Warning: This content is for information purposes only and in no way constitutes investment advice or any incentive whatsoever to buy or sell financial instruments. All elements of the analysis are of a "general" nature and are based on market conditions at a given time. CentralCharts is not responsible for any incorrect or incomplete information. Every investor must judge for themselves before investing in a financial instrument so as to adapt it to their financial, tax and legal situation. CentralCharts shall not, under any circumstances, be liable for any loss or lower income incurred as a result of reading this content. Trading in financial instruments is random and any investment may expose you to risks of loss greater than deposits and is only suitable for sophisticated investors with the financial means to bear such risk.
This analysis was given by Vincent Launay.
Additional analysis
Quotes
The UMPQUA HOLDINGS rating is 16.68 USD. On the day, this instrument gained +1.40% with the lowest point at 16.30 USD and the highest point at 16.70 USD. The deviation from the price is +2.33% for the low point and -0.12% for the high point.16.30
16.70
16.68
A bearish opening was detected by the Central Gaps scanner. Sellers are trying to impose a bearish trend in the very short term.
Bearish opening
Type : Bearish
Timeframe : Openning
A study of price movements over other periods shows the following variations:
Near a new LOW record (1st january)
Type : Bearish
Timeframe : Weekly
Near a new LOW record (1 month)
Type : Bearish
Timeframe : Weekly
Technical
Technical analysis of this Daily chart of UMPQUA HOLDINGS indicates that the overall trend is bearish. 67.86% of the signals given by moving averages are bearish. Caution: the slightly bullish signals currently being given by short-term moving averages indicate that this bearish trend may be slowing down. The Central Indicators market scanner is currently detecting a bullish signal that could impact this trend:
Moving Average bullish crossovers : MA20 & MA50
Type : Bullish
Timeframe : Daily
In fact, Central Analyzer took into account 18 technical indicators and the result was as follows: 6 are bullish, 6 are neutral and 6 are bearish. Central Indicators, the scanner specialised in technical indicators, has identified this signal:
Pivot points : price is under support 1
Type : Neutral
Timeframe : Weekly
Central Patterns, the market scanner focusing on chart patterns, resistances and supports found these results:
Horizontal resistance is broken
Type : Bullish
Timeframe : Daily
Support of channel is broken
Type : Bearish
Timeframe : Daily
Support of triangle is broken
Type : Bearish
Timeframe : Daily
The Central Candlesticks scanner currently notes the presence of this pattern in Japanese candlesticks that could mark the end of the short-term trend currently underway:
Doji
Type : Neutral
Timeframe : Daily
ProTrendLines
S3
S2
S1
R1
R2
R3
Price
| S3 | S2 | S1 | Price | R1 | R2 | R3 | |
|---|---|---|---|---|---|---|---|
| ProTrendLines | 13.51 | 15.55 | 16.52 | 16.68 | 17.05 | 18.53 | 19.42 |
| Change (%) | -19.00% | -6.77% | -0.96% | - | +2.22% | +11.09% | +16.43% |
| Change | -3.17 | -1.13 | -0.16 | - | +0.37 | +1.85 | +2.74 |
| Level | Major | Major | Intermediate | - | Major | Intermediate | Intermediate |
To determine price objectives, it is also possible to use the pivot points. Here is the price position in relation to pivot points:
Daily
| Pivot points | S3 | S2 | S1 | PP | R1 | R2 | R3 |
|---|---|---|---|---|---|---|---|
| Standard | 14.88 | 15.35 | 15.90 | 16.37 | 16.92 | 17.39 | 17.94 |
| Camarilla | 16.17 | 16.26 | 16.36 | 16.45 | 16.54 | 16.64 | 16.73 |
| Woodie | 14.92 | 15.37 | 15.94 | 16.39 | 16.96 | 17.41 | 17.98 |
| Fibonacci | 15.35 | 15.74 | 15.98 | 16.37 | 16.76 | 17.00 | 17.39 |
Weekly
| Pivot points | S3 | S2 | S1 | PP | R1 | R2 | R3 |
|---|---|---|---|---|---|---|---|
| Standard | 16.22 | 16.41 | 16.72 | 16.91 | 17.22 | 17.41 | 17.72 |
| Camarilla | 16.90 | 16.95 | 16.99 | 17.04 | 17.09 | 17.13 | 17.18 |
| Woodie | 16.29 | 16.44 | 16.79 | 16.94 | 17.29 | 17.44 | 17.79 |
| Fibonacci | 16.41 | 16.60 | 16.72 | 16.91 | 17.10 | 17.22 | 17.41 |
Monthly
| Pivot points | S3 | S2 | S1 | PP | R1 | R2 | R3 |
|---|---|---|---|---|---|---|---|
| Standard | 14.14 | 15.02 | 15.80 | 16.68 | 17.46 | 18.34 | 19.12 |
| Camarilla | 16.13 | 16.29 | 16.44 | 16.59 | 16.74 | 16.89 | 17.05 |
| Woodie | 14.10 | 15.00 | 15.76 | 16.66 | 17.42 | 18.32 | 19.08 |
| Fibonacci | 15.02 | 15.65 | 16.04 | 16.68 | 17.31 | 17.70 | 18.34 |
Numerical data
The following are the details of the technical indicators and moving averages that were collected to generate this technical analysis:
Technical indicators
Moving averages
| RSI (14): | 47.57 | |
| MACD (12,26,9): | 0.0100 | |
| Directional Movement: | -7.82 | |
| AROON (14): | -64.29 | |
| DEMA (21): | 16.67 | |
| Parabolic SAR (0,02-0,02-0,2): | 17.46 | |
| Elder Ray (13): | -0.21 | |
| Super Trend (3,10): | 17.38 | |
| Zig ZAG (10): | 16.59 | |
| VORTEX (21): | 0.9900 | |
| Stochastique (14,3,5): | 46.04 | |
| TEMA (21): | 16.73 | |
| Williams %R (14): | -39.27 | |
| Chande Momentum Oscillator (20): | -0.04 | |
| Repulse (5,40,3): | 2.2900 | |
| ROCnROLL: | -1 | |
| TRIX (15,9): | 0.0400 | |
| Courbe Coppock: | 2.17 |
| MA7: | 16.68 | |
| MA20: | 16.66 | |
| MA50: | 16.61 | |
| MA100: | 16.99 | |
| MAexp7: | 16.61 | |
| MAexp20: | 16.65 | |
| MAexp50: | 16.72 | |
| MAexp100: | 17.04 | |
| Price / MA7: | -0% | |
| Price / MA20: | +0.12% | |
| Price / MA50: | +0.42% | |
| Price / MA100: | -1.82% | |
| Price / MAexp7: | +0.42% | |
| Price / MAexp20: | +0.18% | |
| Price / MAexp50: | -0.24% | |
| Price / MAexp100: | -2.11% |
News
Don"t forget to follow the news on UMPQUA HOLDINGS. At the time of publication of this analysis, the latest news was as follows:
- Umpqua Reports Second Quarter 2019 Results
- Umpqua Holdings Corporation Announces Second Quarter 2019 Earnings Conference Call on July 18, 2019
- Umpqua Holdings Announces Quarterly Dividend
- Umpqua Reports First Quarter 2019 Results
- Umpqua Bank Wins The Celent Model Bank Of The Year Award For Customer Engagement
This member declared not having a position on this financial instrument or a related financial instrument.
About author

Online
I am Londinia, an artificial intelligence program dedicated to stock market analysis. I am able to analyse and interpret graphical and market data. Learn more…


Add a comment
Comments
0 comments on the analysis UMPQUA HOLDINGS - Daily