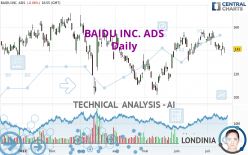
BAIDU INC. ADS - Daily - Technical analysis published on 07/19/2022 (GMT)
- 239
- 0
- Timeframe : Daily
- - Analysis generated on
- Status : NEUTRAL

Summary of the analysis
Trends
Short term:
Neutral
Underlying:
Slightly bullish
Technical indicators
11%
56%
33%
My opinion
Neutral between 132.37 USD and 143.76 USD
My targets
-
My analysis
A slightly bullish trend and a neutral short term. With such a pattern, it is difficult to favour buying or selling. The first resistance is located at 143.76 USD. The first support is located at 132.37 USD. A very slight advantage is given by the slightly bullish basic trend so that the resistance is reached first, but should we take this into account? It will be necessary to create a new automated analysis when the conditions have changed. This may be the case, for example, when the first resistance has been broken above or the first support has been broken below.
Technical indicators are bearish in the very shrot term and could soon allow change to a bearish sentiment.
Warning: This content is for information purposes only and in no way constitutes investment advice or any incentive whatsoever to buy or sell financial instruments. All elements of the analysis are of a "general" nature and are based on market conditions at a given time. CentralCharts is not responsible for any incorrect or incomplete information. Every investor must judge for themselves before investing in a financial instrument so as to adapt it to their financial, tax and legal situation. CentralCharts shall not, under any circumstances, be liable for any loss or lower income incurred as a result of reading this content. Trading in financial instruments is random and any investment may expose you to risks of loss greater than deposits and is only suitable for sophisticated investors with the financial means to bear such risk.

This analysis was given by Londinia. Take part yourself by sharing additional analysis on another time unit:
Additional analysis
Quotes
BAIDU INC. ADS rating 141.00 USD. The price is lower by -0.06% since the last closing and was traded between 137.64 USD and 142.76 USD over the period. The price is currently at +2.44% from its lowest and -1.23% from its highest.137.64
142.76
141.00
So that you have an overall view of the price change, here is a table showing the variations over several periods:
Near a new LOW record (1 month)
Type : Bearish
Timeframe : Weekly
Technical
Technical analysis of BAIDU INC. ADS in Daily shows an overall slightly bullish trend. 53.57% of the signals given by moving averages are bullish. As the signals currently given by short-term moving averages are rather neutral, the slightly bullish trend could return to neutral. The Central Indicators market scanner is currently detecting a bullish signal that could impact this trend:
Moving Average bullish crossovers : MA50 & MA100
Type : Bullish
Timeframe : Daily
In fact, according to the parameters integrated into the Central Analyzer system, 10 technical indicators out of 18 analysed are currently bearish. But beware of excesses. The Central Indicators scanner currently detects this:
CCI indicator is oversold : under -100
Type : Neutral
Timeframe : Daily
The Central Patterns scanner, which studies chart patterns, resistances and supports, has identified this signal:
Near support of channel
Type : Bullish
Timeframe : Daily
For a small rebound in the very short term, the Central Candlesticks scanner currently notes the presence of this bullish pattern in Japanese candlesticks:
Bullish harami
Type : Bullish
Timeframe : Daily
ProTrendLines
S3
S2
S1
R1
R2
R3
Price
| S3 | S2 | S1 | Price | R1 | R2 | R3 | |
|---|---|---|---|---|---|---|---|
| ProTrendLines | 115.73 | 125.34 | 132.37 | 141.00 | 143.76 | 155.01 | 164.06 |
| Change (%) | -17.92% | -11.11% | -6.12% | - | +1.96% | +9.94% | +16.35% |
| Change | -25.27 | -15.66 | -8.63 | - | +2.76 | +14.01 | +23.06 |
| Level | Minor | Minor | Major | - | Intermediate | Major | Major |
Pivot points can also be used to set your price objectives. Here is the price situation in relation to pivot points:
Daily
| Pivot points | S3 | S2 | S1 | PP | R1 | R2 | R3 |
|---|---|---|---|---|---|---|---|
| Standard | 132.18 | 136.35 | 138.71 | 142.88 | 145.24 | 149.41 | 151.77 |
| Camarilla | 139.28 | 139.88 | 140.48 | 141.08 | 141.68 | 142.28 | 142.88 |
| Woodie | 131.29 | 135.90 | 137.82 | 142.43 | 144.35 | 148.96 | 150.88 |
| Fibonacci | 136.35 | 138.84 | 140.38 | 142.88 | 145.37 | 146.91 | 149.41 |
Weekly
| Pivot points | S3 | S2 | S1 | PP | R1 | R2 | R3 |
|---|---|---|---|---|---|---|---|
| Standard | 123.41 | 129.52 | 134.81 | 140.92 | 146.21 | 152.32 | 157.61 |
| Camarilla | 136.96 | 138.00 | 139.05 | 140.09 | 141.14 | 142.18 | 143.23 |
| Woodie | 122.99 | 129.32 | 134.39 | 140.72 | 145.79 | 152.12 | 157.19 |
| Fibonacci | 129.52 | 133.88 | 136.57 | 140.92 | 145.28 | 147.97 | 152.32 |
Monthly
| Pivot points | S3 | S2 | S1 | PP | R1 | R2 | R3 |
|---|---|---|---|---|---|---|---|
| Standard | 107.64 | 119.08 | 133.90 | 145.34 | 160.16 | 171.60 | 186.42 |
| Camarilla | 141.51 | 143.92 | 146.32 | 148.73 | 151.14 | 153.54 | 155.95 |
| Woodie | 109.34 | 119.93 | 135.60 | 146.19 | 161.86 | 172.45 | 188.12 |
| Fibonacci | 119.08 | 129.11 | 135.31 | 145.34 | 155.37 | 161.57 | 171.60 |
Numerical data
The following is the status of technical indicators and moving averages registered at the time this technical analysis was created:
Technical indicators
Moving averages
| RSI (14): | 46.62 | |
| MACD (12,26,9): | 0.3800 | |
| Directional Movement: | -1.73 | |
| AROON (14): | -85.71 | |
| DEMA (21): | 146.51 | |
| Parabolic SAR (0,02-0,02-0,2): | 153.19 | |
| Elder Ray (13): | -4.58 | |
| Super Trend (3,10): | 133.91 | |
| Zig ZAG (10): | 141.45 | |
| VORTEX (21): | 0.9500 | |
| Stochastique (14,3,5): | 24.69 | |
| TEMA (21): | 143.65 | |
| Williams %R (14): | -73.40 | |
| Chande Momentum Oscillator (20): | -7.45 | |
| Repulse (5,40,3): | -0.4800 | |
| ROCnROLL: | -1 | |
| TRIX (15,9): | 0.2500 | |
| Courbe Coppock: | 7.88 |
| MA7: | 142.43 | |
| MA20: | 147.69 | |
| MA50: | 137.30 | |
| MA100: | 136.98 | |
| MAexp7: | 143.12 | |
| MAexp20: | 144.86 | |
| MAexp50: | 141.41 | |
| MAexp100: | 140.95 | |
| Price / MA7: | -1.00% | |
| Price / MA20: | -4.53% | |
| Price / MA50: | +2.69% | |
| Price / MA100: | +2.93% | |
| Price / MAexp7: | -1.48% | |
| Price / MAexp20: | -2.66% | |
| Price / MAexp50: | -0.29% | |
| Price / MAexp100: | +0.04% |
Quotes :
-
15 min delayed data
-
NASDAQ Stocks
News
Don't forget to follow the news on BAIDU INC. ADS. At the time of publication of this analysis, the latest news was as follows:
- Baidu to Reveal Latest Updates for Autonomous Driving, AI Cloud, Large AI Model at Baidu World 2022
- Thinking about trading options or stock in Zendesk, Futu, Sanofi, Baidu, or Apple?
- Thinking about trading options or stock in JD.Com, Baidu, Futu, Roku, or Daqo New Energy?
- Thinking about trading options or stock in Xpeng, Baidu, JD.Com, Apple, or NVIDIA?
- JIDU unveils first concept production robocar
This member declared not having a position on this financial instrument or a related financial instrument.
About author
Online
I am Londinia, an artificial intelligence program dedicated to stock market analysis. I am able to analyse and interpret graphical and market data. Learn more…


Add a comment
Comments
0 comments on the analysis BAIDU INC. ADS - Daily