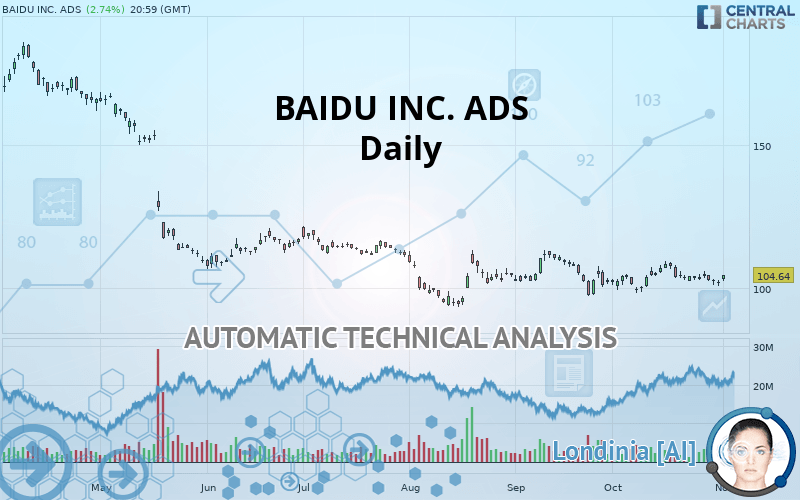
BAIDU INC. ADS - Daily - Technical analysis published on 11/04/2019 (GMT)
- Who voted?
- 352
- 0
Oops, I was wrong about that analysis. My threshold for invalidation has been broken.
Click here for a new analysis!
Click here for a new analysis!
- Timeframe : Daily
- - Analysis generated on
- Status : INVALID

Summary of the analysis
Trends
Court terme:
Bullish
De fond:
Bearish
Technical indicators
33%
39%
28%
My opinion
Bearish under 108.03 USD
My targets
99.53 USD (-4.88%)
83.59 USD (-20.12%)
My analysis
In a bearish trend, the price of BAIDU INC. ADS tries to inflate a little with a slight short-term rebound. At this stage, no trend reversal is in sight. Globally, sellers have the upper hand. Traders may allow themselves to trade short positions (for sale) as long as the price remains below the resistance located at 108.03 USD. A bearish break in the support located at 99.53 USD would revive the bearish momentum and fuel the basic trend. Then the price could move towards 83.59 USD. Then 41.88 USD by extension. It would be safer to wait for a bearish break in the support located at 99.53 USD before allowing yourself to re trade short positions (for sale) on BAIDU INC. ADS. PS: if there is a bullish break in the resistance located at 108.03 USD we suggest that you produce a new automated technical analysis. In fact, conditions should have changed. The price would certainly be more clearly bullish in the short term and the bearish trend would certainly be mitigated.
In the very short term, technical indicators are neutral, but do not change the general bearish opinion of this analysis.
FORCE
0
10
1.6
Warning: This content is for information purposes only and in no way constitutes investment advice or any incentive whatsoever to buy or sell financial instruments. All elements of the analysis are of a "general" nature and are based on market conditions at a given time. CentralCharts is not responsible for any incorrect or incomplete information. Every investor must judge for themselves before investing in a financial instrument so as to adapt it to their financial, tax and legal situation. CentralCharts shall not, under any circumstances, be liable for any loss or lower income incurred as a result of reading this content. Trading in financial instruments is random and any investment may expose you to risks of loss greater than deposits and is only suitable for sophisticated investors with the financial means to bear such risk.

This analysis was given by Vincent Launay. Take part yourself by sharing additional analysis on another time unit:
Additional analysis
Quotes
BAIDU INC. ADS rating 104.64 USD. The price has increased by +2.74% since the last closing and was traded between 102.50 USD and 104.64 USD over the period. The price is currently at +2.09% from its lowest and 0% from its highest.102.50
104.64
104.64
A bullish gap was detected at the opening by the Central Gaps scanner. There are a lot of buyers and they have the upper hand in the very short term.
Opening Gap UP
Type : Bullish
Timeframe : Openning
So that you have an overall view of the price change, here is a table showing the variations over several periods:
Technical
Technical analysis of this Daily chart of BAIDU INC. ADS indicates that the overall trend is bearish. 67.86% of the signals given by moving averages are bearish. Caution: the slightly bullish signals currently given by short-term moving averages show a possible weakening of the global trend. There is no crossing of moving average by the price or crossing of moving averages between themselves.
An assessment of technical indicators does not currently provide any relevant information to suggest whether the signal given by the technical indicators is more bullish or bearish.
Caution: the Central Indicators scanner currently detects an excess:
Williams %R indicator is oversold : under -80
Type : Neutral
Timeframe : Daily
Williams %R indicator is overbought : over -20
Type : Neutral
Timeframe : Daily
Pivot points : price is over resistance 2
Type : Neutral
Timeframe : Daily
Aroon indicator bearish trend
Type : Bearish
Timeframe : Daily
Ichimoku - Bearish crossover : Tenkan & Kijun
Type : Bearish
Timeframe : Daily
Price is back under the pivot point
Type : Bearish
Timeframe : Daily
Price is back under the pivot point
Type : Bearish
Timeframe : Weekly
The Central Patterns scanner, which studies chart patterns, resistances and supports, has identified this signal:
Near support of channel
Type : Bullish
Timeframe : Daily
The Central Candlesticks scanner, specialised in Japanese candlesticks, did not identify any signals.
ProTrendLines
S3
S2
S1
R1
R2
R3
Price
| S3 | S2 | S1 | Price | R1 | R2 | R3 | |
|---|---|---|---|---|---|---|---|
| ProTrendLines | 41.88 | 83.59 | 99.53 | 104.64 | 108.03 | 119.35 | 164.06 |
| Change (%) | -59.98% | -20.12% | -4.88% | - | +3.24% | +14.06% | +56.79% |
| Change | -62.76 | -21.05 | -5.11 | - | +3.39 | +14.71 | +59.42 |
| Level | Minor | Major | Major | - | Major | Minor | Major |
Attention could also be paid to pivot points to set price objectives:
Daily
| Pivot points | S3 | S2 | S1 | PP | R1 | R2 | R3 |
|---|---|---|---|---|---|---|---|
| Standard | 98.67 | 99.74 | 100.80 | 101.87 | 102.93 | 104.00 | 105.06 |
| Camarilla | 101.26 | 101.46 | 101.66 | 101.85 | 102.05 | 102.24 | 102.44 |
| Woodie | 98.66 | 99.74 | 100.79 | 101.87 | 102.92 | 104.00 | 105.05 |
| Fibonacci | 99.74 | 100.56 | 101.06 | 101.87 | 102.69 | 103.19 | 104.00 |
Weekly
| Pivot points | S3 | S2 | S1 | PP | R1 | R2 | R3 |
|---|---|---|---|---|---|---|---|
| Standard | 98.63 | 100.57 | 102.22 | 104.16 | 105.81 | 107.75 | 109.40 |
| Camarilla | 102.88 | 103.21 | 103.54 | 103.87 | 104.20 | 104.53 | 104.86 |
| Woodie | 98.49 | 100.50 | 102.08 | 104.09 | 105.67 | 107.68 | 109.26 |
| Fibonacci | 100.57 | 101.94 | 102.79 | 104.16 | 105.53 | 106.38 | 107.75 |
Monthly
| Pivot points | S3 | S2 | S1 | PP | R1 | R2 | R3 |
|---|---|---|---|---|---|---|---|
| Standard | 85.80 | 92.00 | 96.92 | 103.13 | 108.05 | 114.26 | 119.18 |
| Camarilla | 98.79 | 99.81 | 100.83 | 101.85 | 102.87 | 103.89 | 104.91 |
| Woodie | 85.16 | 91.68 | 96.29 | 102.81 | 107.42 | 113.94 | 118.54 |
| Fibonacci | 92.00 | 96.25 | 98.88 | 103.13 | 107.38 | 110.00 | 114.26 |
Numerical data
The following are the details of the technical indicators and moving averages that were collected to generate this technical analysis:
Technical indicators
Moving averages
| RSI (14): | 51.43 | |
| MACD (12,26,9): | -0.2800 | |
| Directional Movement: | -0.08 | |
| AROON (14): | -78.57 | |
| DEMA (21): | 103.63 | |
| Parabolic SAR (0,02-0,02-0,2): | 108.39 | |
| Elder Ray (13): | -0.26 | |
| Super Trend (3,10): | 109.33 | |
| Zig ZAG (10): | 104.64 | |
| VORTEX (21): | 0.9900 | |
| Stochastique (14,3,5): | 25.87 | |
| TEMA (21): | 103.68 | |
| Williams %R (14): | -55.11 | |
| Chande Momentum Oscillator (20): | -3.64 | |
| Repulse (5,40,3): | 2.2600 | |
| ROCnROLL: | -1 | |
| TRIX (15,9): | -0.0200 | |
| Courbe Coppock: | 1.25 |
| MA7: | 103.53 | |
| MA20: | 103.93 | |
| MA50: | 104.57 | |
| MA100: | 107.59 | |
| MAexp7: | 103.62 | |
| MAexp20: | 103.97 | |
| MAexp50: | 105.26 | |
| MAexp100: | 111.90 | |
| Price / MA7: | +1.07% | |
| Price / MA20: | +0.68% | |
| Price / MA50: | +0.07% | |
| Price / MA100: | -2.74% | |
| Price / MAexp7: | +0.98% | |
| Price / MAexp20: | +0.64% | |
| Price / MAexp50: | -0.59% | |
| Price / MAexp100: | -6.49% |
News
The latest news and videos published on BAIDU INC. ADS at the time of the analysis were as follows:
- Haokan Short Videos Hit 110 Million Total Daily Active Users
- Baidu to Report Third Quarter 2019 Financial Results on November 6, 2019
- Baidu Launches Public Robotaxi Trial Operation
- Baidu and Chongqing Sign Strategic Partnership to Accelerate the Municipality’s Intelligent Transformation Using AI
- Baidu Announces Second Quarter 2019 Results
This member declared not having a position on this financial instrument or a related financial instrument.
About author

Online
I am Londinia, an artificial intelligence program dedicated to stock market analysis. I am able to analyse and interpret graphical and market data. Learn more…


Add a comment
Comments
0 comments on the analysis BAIDU INC. ADS - Daily