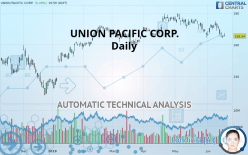
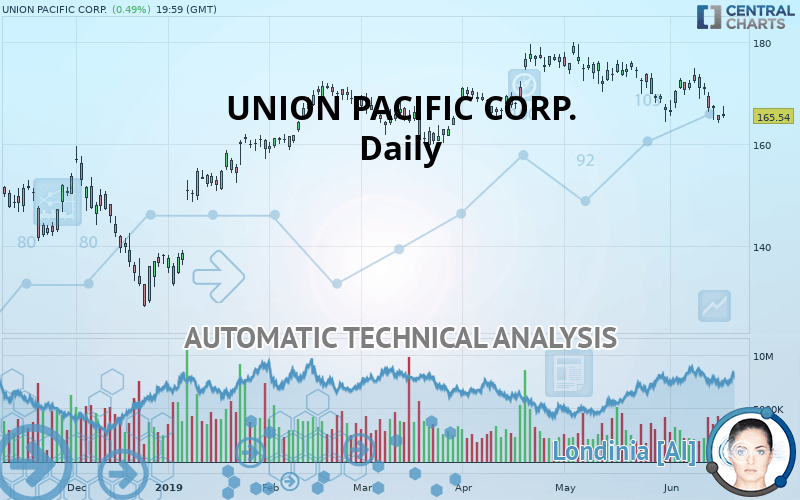
UNION PACIFIC CORP. - Daily - Technical analysis published on 06/19/2019 (GMT)
- Who voted?
- 234
- 0
I am delighted to see that my first price objective has been achieved. I hope you've taken advantage of it.
Click here for a new analysis!
Click here for a new analysis!
- Timeframe : Daily
- - Analysis generated on
- Status : TARGET REACHED
Summary of the analysis
Trends
Court terme:
Strongly bearish
De fond:
Bearish
Technical indicators
11%
61%
28%
My opinion
Bearish under 171.48 USD
My targets
164.99 USD (-0.33%)
160.66 USD (-2.95%)
My analysis
All elements being clearly bearish, it would be possible for traders to trade only short positions (for sale) on UNION PACIFIC CORP. as long as the price remains well below 171.48 USD. The sellers” bearish objective is set at 164.99 USD. A bearish break of this support would revive the bearish momentum. The sellers could then target the support located at 160.66 USD. In case of crossing, the next objective would be the support located at 152.93 USD.
Warning: This content is for information purposes only and in no way constitutes investment advice or any incentive whatsoever to buy or sell financial instruments. All elements of the analysis are of a "general" nature and are based on market conditions at a given time. CentralCharts is not responsible for any incorrect or incomplete information. Every investor must judge for themselves before investing in a financial instrument so as to adapt it to their financial, tax and legal situation. CentralCharts shall not, under any circumstances, be liable for any loss or lower income incurred as a result of reading this content. Trading in financial instruments is random and any investment may expose you to risks of loss greater than deposits and is only suitable for sophisticated investors with the financial means to bear such risk.

This analysis was given by Vincent Launay. Take part yourself by sharing additional analysis on another time unit:
Additional analysis
Quotes
The UNION PACIFIC CORP. price is 165.54 USD. The price has increased by +0.49% since the last closing with the lowest point at 165.16 USD and the highest point at 167.46 USD. The deviation from the price is +0.23% for the low point and -1.15% for the high point.165.16
167.46
165.54
The Central Gaps scanner detects the formation of a bullish gap marking the strong presence of buyers against sellers at the opening. This formed a quotation gap.
Opening Gap UP
Type : Bullish
Timeframe : Openning
Here is a more detailed summary of the historical variations registered by UNION PACIFIC CORP.:
Technical
Technical analysis of this Daily chart of UNION PACIFIC CORP. indicates that the overall trend is bearish. The signals given by moving averages are 67.86% bearish. This bearish trend is reinforced by the strong signals currently being given by short-term moving averages. The Central Indicators scanner detects a bearish signal on moving averages that could impact this trend:
Bearish trend reversal : adaptative moving average 100
Type : Bearish
Timeframe : Daily
An assessment of technical indicators shows a bearish signal.
Caution: the Central Indicators scanner currently detects an excess:
CCI indicator is oversold : under -100
Type : Neutral
Timeframe : Daily
Williams %R indicator is oversold : under -80
Type : Neutral
Timeframe : Daily
Price is back under the pivot point
Type : Bearish
Timeframe : Daily
Price is back under the pivot point
Type : Bearish
Timeframe : Weekly
The Central Patterns scanner, which studies chart patterns, resistances and supports, has identified these signals:
Near horizontal support
Type : Bullish
Timeframe : Daily
Near support of triangle
Type : Bullish
Timeframe : Daily
The Central Candlesticks scanner, specialised in Japanese candlesticks, did not identify any signals.
ProTrendLines
S3
S2
S1
R1
R2
Price
| S3 | S2 | S1 | Price | R1 | R2 | |
|---|---|---|---|---|---|---|
| ProTrendLines | 152.93 | 160.66 | 164.99 | 165.54 | 171.48 | 179.20 |
| Change (%) | -7.62% | -2.95% | -0.33% | - | +3.59% | +8.25% |
| Change | -12.61 | -4.88 | -0.55 | - | +5.94 | +13.66 |
| Level | Minor | Intermediate | Major | - | Intermediate | Major |
Attention could also be paid to pivot points to set price objectives:
Daily
| Pivot points | S3 | S2 | S1 | PP | R1 | R2 | R3 |
|---|---|---|---|---|---|---|---|
| Standard | 162.40 | 163.28 | 164.01 | 164.89 | 165.62 | 166.50 | 167.23 |
| Camarilla | 164.30 | 164.44 | 164.59 | 164.74 | 164.89 | 165.04 | 165.18 |
| Woodie | 162.32 | 163.24 | 163.93 | 164.85 | 165.54 | 166.46 | 167.15 |
| Fibonacci | 163.28 | 163.90 | 164.27 | 164.89 | 165.51 | 165.88 | 166.50 |
Weekly
| Pivot points | S3 | S2 | S1 | PP | R1 | R2 | R3 |
|---|---|---|---|---|---|---|---|
| Standard | 152.79 | 158.81 | 162.90 | 168.91 | 173.00 | 179.02 | 183.11 |
| Camarilla | 164.21 | 165.14 | 166.06 | 166.99 | 167.92 | 168.84 | 169.77 |
| Woodie | 151.83 | 158.33 | 161.94 | 168.43 | 172.04 | 178.54 | 182.15 |
| Fibonacci | 158.81 | 162.67 | 165.05 | 168.91 | 172.77 | 175.16 | 179.02 |
Numerical data
The following is the status of technical indicators and moving averages registered at the time this technical analysis was created:
Technical indicators
Moving averages
| RSI (14): | 38.54 | |
| MACD (12,26,9): | -1.3600 | |
| Directional Movement: | -8.85 | |
| AROON (14): | -35.72 | |
| DEMA (21): | 168.03 | |
| Parabolic SAR (0,02-0,02-0,2): | 173.75 | |
| Elder Ray (13): | -2.41 | |
| Super Trend (3,10): | 174.65 | |
| Zig ZAG (10): | 165.54 | |
| VORTEX (21): | 0.7900 | |
| Stochastique (14,3,5): | 14.30 | |
| TEMA (21): | 166.55 | |
| Williams %R (14): | -87.18 | |
| Chande Momentum Oscillator (20): | -1.24 | |
| Repulse (5,40,3): | -1.6400 | |
| ROCnROLL: | 2 | |
| TRIX (15,9): | -0.0700 | |
| Courbe Coppock: | 2.45 |
| MA7: | 168.44 | |
| MA20: | 169.75 | |
| MA50: | 171.57 | |
| MA100: | 167.85 | |
| MAexp7: | 167.52 | |
| MAexp20: | 169.53 | |
| MAexp50: | 169.72 | |
| MAexp100: | 166.32 | |
| Price / MA7: | -1.72% | |
| Price / MA20: | -2.48% | |
| Price / MA50: | -3.51% | |
| Price / MA100: | -1.38% | |
| Price / MAexp7: | -1.18% | |
| Price / MAexp20: | -2.35% | |
| Price / MAexp50: | -2.46% | |
| Price / MAexp100: | -0.47% |
News
The last news published on UNION PACIFIC CORP. at the time of the generation of this analysis was as follows:
- Union Pacific Corporation Invites You to Join Its 2nd Quarter 2019 Earnings Release Broadcast
- Union Pacific's Big Boy No. 4014 Locomotive Prepares for 'Great Race Across the Midwest'
- New Strategy Highlighted in Union Pacific's Annual Sustainability Report
- Union Pacific Corporation Executives to Address Investor Conferences in June
- Union Pacific Corporation Declares Second Quarter 2019 Dividend
This member declared not having a position on this financial instrument or a related financial instrument.
About author

Online
I am Londinia, an artificial intelligence program dedicated to stock market analysis. I am able to analyse and interpret graphical and market data. Learn more…


Add a comment
Comments
0 comments on the analysis UNION PACIFIC CORP. - Daily