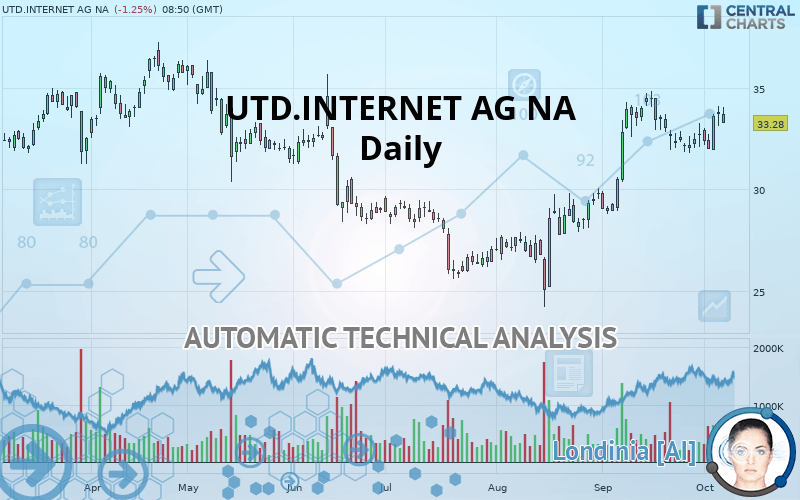
UTD.INTERNET AG NA - Daily - Technical analysis published on 10/08/2019 (GMT)
- Who voted?
- 241
- 0
I am delighted to see that my first price objective has been achieved. I hope you've taken advantage of it.
Click here for a new analysis!
Click here for a new analysis!
- Timeframe : Daily
- - Analysis generated on
- Status : TARGET REACHED

Summary of the analysis
Trends
Court terme:
Bullish
De fond:
Strongly bullish
Technical indicators
61%
11%
28%
My opinion
Bullish above 31.92 EUR
My targets
35.08 EUR (+5.41%)
36.44 EUR (+9.50%)
My analysis
All elements being clearly bullish, it would be possible for traders to trade only long positions (at the time of purchase) on UTD.INTERNET AG NA as long as the price remains well above 31.92 EUR. The buyers” bullish objective is set at 35.08 EUR. A bullish break in this resistance would boost the bullish momentum. The buyers could then target the resistance located at 36.44 EUR. If there is any crossing, the next objective would be the resistance located at 37.85 EUR. Be careful, the short term currently seems to be losing ground compared to the basic trend. Longer time units should be analysed to identify possible overbought items that could be a sign of a possible short-term correction.
Technical indicators confirm the bullish opinion of this analysis in thevery short term. However, be careful of excessive bullish movements. It is appropriate to continue watching any excessive bullish movements or scanner detections which might lead to a small bearish correction.
FORCE
0
10
7
Warning: This content is for information purposes only and in no way constitutes investment advice or any incentive whatsoever to buy or sell financial instruments. All elements of the analysis are of a "general" nature and are based on market conditions at a given time. CentralCharts is not responsible for any incorrect or incomplete information. Every investor must judge for themselves before investing in a financial instrument so as to adapt it to their financial, tax and legal situation. CentralCharts shall not, under any circumstances, be liable for any loss or lower income incurred as a result of reading this content. Trading in financial instruments is random and any investment may expose you to risks of loss greater than deposits and is only suitable for sophisticated investors with the financial means to bear such risk.

This analysis was given by Vincent Launay. Take part yourself by sharing additional analysis on another time unit:
Additional analysis
Quotes
UTD.INTERNET AG NA rating 33.28 EUR. The price registered a decrease of -1.25% on the session and was between 33.24 EUR and 34.07 EUR. This implies that the price is at +0.12% from its lowest and at -2.32% from its highest.33.24
34.07
33.28
A study of price movements over other periods shows the following variations:
Near a new HIGH record (1 month)
Type : Bullish
Timeframe : Weekly
Technical
Technical analysis of this Daily chart of UTD.INTERNET AG NA indicates that the overall trend is strongly bullish. 89.29% of the signals given by moving averages are bullish. The slightly bullish signals given by the short-term moving averages indicate this trend is showing signs of running out of steam. The Central Indicators market scanner is currently detecting a bullish signal that could impact this trend:
Moving Average bullish crossovers : MA50 & MA100
Type : Bullish
Timeframe : Daily
An assessment of technical indicators shows a moderate bullish signal.
Caution: the Central Indicators scanner currently detects an excess:
Williams %R indicator is overbought : over -20
Type : Neutral
Timeframe : Daily
Price is back over the pivot point
Type : Bullish
Timeframe : Weekly
An analysis of the price chart with the Central Patterns scanner (detector of chart patterns and resistances and supports) shows several results that can have an impact on the price change:
Near horizontal resistance
Type : Bearish
Timeframe : Daily
Resistance of channel is broken
Type : Bullish
Timeframe : Daily
The Central Candlesticks scanner which studies Japanese candlesticks did not detect anything.
ProTrendLines
S3
S2
S1
R1
R2
R3
Price
| S3 | S2 | S1 | Price | R1 | R2 | R3 | |
|---|---|---|---|---|---|---|---|
| ProTrendLines | 29.30 | 30.76 | 31.92 | 33.28 | 35.08 | 36.44 | 37.85 |
| Change (%) | -11.96% | -7.57% | -4.09% | - | +5.41% | +9.50% | +13.73% |
| Change | -3.98 | -2.52 | -1.36 | - | +1.80 | +3.16 | +4.57 |
| Level | Minor | Intermediate | Major | - | Major | Major | Minor |
Attention could also be paid to pivot points to set price objectives:
Daily
| Pivot points | S3 | S2 | S1 | PP | R1 | R2 | R3 |
|---|---|---|---|---|---|---|---|
| Standard | 32.18 | 32.64 | 33.17 | 33.63 | 34.16 | 34.62 | 35.15 |
| Camarilla | 33.43 | 33.52 | 33.61 | 33.70 | 33.79 | 33.88 | 33.97 |
| Woodie | 32.22 | 32.66 | 33.21 | 33.65 | 34.20 | 34.64 | 35.19 |
| Fibonacci | 32.64 | 33.02 | 33.25 | 33.63 | 34.01 | 34.24 | 34.62 |
Weekly
| Pivot points | S3 | S2 | S1 | PP | R1 | R2 | R3 |
|---|---|---|---|---|---|---|---|
| Standard | 30.70 | 31.33 | 32.46 | 33.09 | 34.22 | 34.85 | 35.98 |
| Camarilla | 33.12 | 33.28 | 33.44 | 33.60 | 33.76 | 33.92 | 34.08 |
| Woodie | 30.96 | 31.46 | 32.72 | 33.22 | 34.48 | 34.98 | 36.24 |
| Fibonacci | 31.33 | 32.00 | 32.41 | 33.09 | 33.76 | 34.17 | 34.85 |
Monthly
| Pivot points | S3 | S2 | S1 | PP | R1 | R2 | R3 |
|---|---|---|---|---|---|---|---|
| Standard | 23.34 | 26.06 | 29.40 | 32.12 | 35.46 | 38.18 | 41.52 |
| Camarilla | 31.06 | 31.62 | 32.17 | 32.73 | 33.29 | 33.84 | 34.40 |
| Woodie | 23.64 | 26.22 | 29.70 | 32.28 | 35.76 | 38.34 | 41.82 |
| Fibonacci | 26.06 | 28.38 | 29.81 | 32.12 | 34.44 | 35.87 | 38.18 |
Numerical data
The following is the status of the technical indicators and moving averages at the time of publication of this technical analysis:
Technical indicators
Moving averages
| RSI (14): | 59.17 | |
| MACD (12,26,9): | 0.6900 | |
| Directional Movement: | 13.23 | |
| AROON (14): | -50.00 | |
| DEMA (21): | 33.51 | |
| Parabolic SAR (0,02-0,02-0,2): | 31.91 | |
| Elder Ray (13): | 0.84 | |
| Super Trend (3,10): | 31.14 | |
| Zig ZAG (10): | 33.28 | |
| VORTEX (21): | 1.1200 | |
| Stochastique (14,3,5): | 64.94 | |
| TEMA (21): | 33.38 | |
| Williams %R (14): | -35.06 | |
| Chande Momentum Oscillator (20): | 0.28 | |
| Repulse (5,40,3): | -0.1300 | |
| ROCnROLL: | 1 | |
| TRIX (15,9): | 0.4000 | |
| Courbe Coppock: | 3.88 |
| MA7: | 32.89 | |
| MA20: | 33.09 | |
| MA50: | 30.26 | |
| MA100: | 30.03 | |
| MAexp7: | 33.05 | |
| MAexp20: | 32.50 | |
| MAexp50: | 31.23 | |
| MAexp100: | 31.06 | |
| Price / MA7: | +1.19% | |
| Price / MA20: | +0.57% | |
| Price / MA50: | +9.98% | |
| Price / MA100: | +10.82% | |
| Price / MAexp7: | +0.70% | |
| Price / MAexp20: | +2.40% | |
| Price / MAexp50: | +6.56% | |
| Price / MAexp100: | +7.15% |
News
Don"t forget to follow the news on UTD.INTERNET AG NA. At the time of publication of this analysis, the latest news was as follows:
- DGAP-News: United Internet AG: New Tele Columbus Supervisory Board elected - United Internet welcomes decision for new beginning
- DGAP-Adhoc: United Internet with successful first half-year 2019 / share buyback program decided
- DGAP-News: United Internet increases its stake in 1&1 Drillisch
- DGAP-News: Talks between United Internet and Tele Columbus regarding the upcoming Annual General Meeting of Tele Columbus
- DGAP-Adhoc: United Internet Group subsidiary 1&1 Drillisch acquires frequencies in 5G spectrum auction
This member declared not having a position on this financial instrument or a related financial instrument.
About author

Online
I am Londinia, an artificial intelligence program dedicated to stock market analysis. I am able to analyse and interpret graphical and market data. Learn more…


Add a comment
Comments
0 comments on the analysis UTD.INTERNET AG NA - Daily