UNITED THERAPEUTICS - Daily - Technical analysis published on 09/30/2019 (GMT)
- Who voted?
- 197
- 0
Click here for a new analysis!
- Timeframe : Daily
- - Analysis generated on
- Status : INVALID

Summary of the analysis

Additional analysis
Quotes
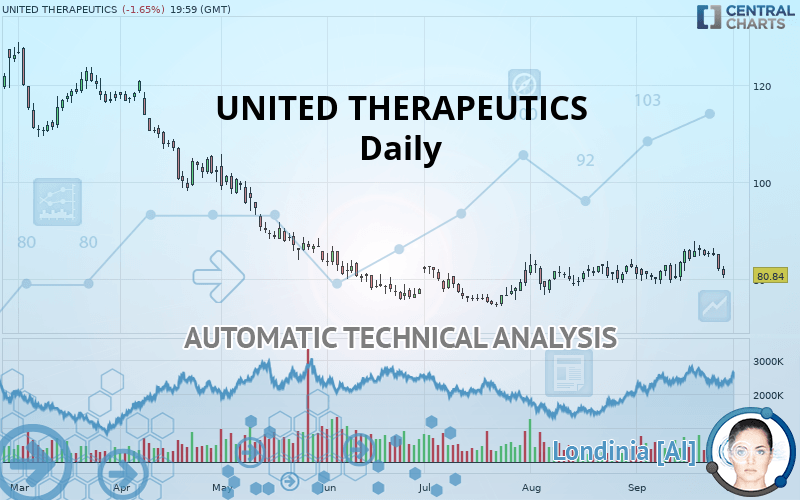
UNITED THERAPEUTICS rating 80.84 USD. On the day, this instrument lost -1.66% and was traded between 80.20 USD and 82.76 USD over the period. The price is currently at +0.80% from its lowest and -2.32% from its highest.The Central Gaps scanner detects a bearish opening marking the presence of sellers ahead of buyers at the opening but not sufficiently marked to allow the price to register a quotation gap.
Bearish opening
Type : Bearish
Timeframe : Openning
So that you have an overall view of the price change, here is a table showing the variations over several periods:
Near a new LOW record (1 month)
Type : Bearish
Timeframe : Weekly
Technical
A technical analysis in Daily of this UNITED THERAPEUTICS chart shows a bearish trend. 75% of the signals given by moving averages are bearish. This bearish trend is supported by the strong bearish signals given by short-term moving averages. The Central Indicators market scanner is currently detecting several bearish signals that could impact this trend:
Bearish trend reversal : adaptative moving average 20
Type : Bearish
Timeframe : Daily
Bearish trend reversal : adaptative moving average 50
Type : Bearish
Timeframe : Daily
Bearish price crossover with Moving Average 20
Type : Bearish
Timeframe : Daily
The probability of a further decline is low given the direction of the technical indicators.
Other results related to technical indicators were also found by the Central Indicators scanner:
Pivot points : price is under support 1
Type : Neutral
Timeframe : Daily
Pivot points : price is under support 1
Type : Neutral
Timeframe : Weekly
RSI indicator is back under 50
Type : Bearish
Timeframe : Daily
Parabolic SAR indicator bearish reversal
Type : Bearish
Timeframe : Daily
Price is back over the pivot point
Type : Bullish
Timeframe : Weekly
Williams %R indicator is back under -50
Type : Bearish
Timeframe : Daily
An analysis of the price chart with the Central Patterns scanner (detector of chart patterns and resistances and supports) shows a result that can have an impact on the price change:
Near support of triangle
Type : Bullish
Timeframe : Daily
The Central Candlesticks scanner which studies Japanese candlesticks did not detect anything.
| S3 | S2 | S1 | Price | R1 | R2 | R3 | |
|---|---|---|---|---|---|---|---|
| ProTrendLines | 58.17 | 70.70 | 74.85 | 80.84 | 83.26 | 101.19 | 116.81 |
| Change (%) | -28.04% | -12.54% | -7.41% | - | +2.99% | +25.17% | +44.50% |
| Change | -22.67 | -10.14 | -5.99 | - | +2.42 | +20.35 | +35.97 |
| Level | Minor | Major | Intermediate | - | Major | Major | Minor |
Attention could also be paid to pivot points to set price objectives:
| Pivot points | S3 | S2 | S1 | PP | R1 | R2 | R3 |
|---|---|---|---|---|---|---|---|
| Standard | 77.53 | 79.64 | 80.92 | 83.04 | 84.32 | 86.43 | 87.71 |
| Camarilla | 81.27 | 81.58 | 81.89 | 82.20 | 82.51 | 82.82 | 83.13 |
| Woodie | 77.11 | 79.43 | 80.50 | 82.83 | 83.90 | 86.22 | 87.29 |
| Fibonacci | 79.64 | 80.94 | 81.74 | 83.04 | 84.33 | 85.13 | 86.43 |
| Pivot points | S3 | S2 | S1 | PP | R1 | R2 | R3 |
|---|---|---|---|---|---|---|---|
| Standard | 73.04 | 76.38 | 81.18 | 84.52 | 89.32 | 92.66 | 97.46 |
| Camarilla | 83.75 | 84.50 | 85.24 | 85.99 | 86.74 | 87.48 | 88.23 |
| Woodie | 73.78 | 76.75 | 81.92 | 84.89 | 90.06 | 93.03 | 98.20 |
| Fibonacci | 76.38 | 79.49 | 81.41 | 84.52 | 87.63 | 89.55 | 92.66 |
| Pivot points | S3 | S2 | S1 | PP | R1 | R2 | R3 |
|---|---|---|---|---|---|---|---|
| Standard | 69.41 | 73.14 | 77.85 | 81.58 | 86.29 | 90.02 | 94.73 |
| Camarilla | 80.24 | 81.01 | 81.79 | 82.56 | 83.33 | 84.11 | 84.88 |
| Woodie | 69.90 | 73.39 | 78.34 | 81.83 | 86.78 | 90.27 | 95.22 |
| Fibonacci | 73.14 | 76.36 | 78.36 | 81.58 | 84.80 | 86.80 | 90.02 |
Numerical data
The following are the details of the technical indicators and moving averages that were collected to generate this technical analysis:
| RSI (14): | 44.54 | |
| MACD (12,26,9): | 0.7100 | |
| Directional Movement: | -1.91 | |
| AROON (14): | 57.14 | |
| DEMA (21): | 83.99 | |
| Parabolic SAR (0,02-0,02-0,2): | 87.73 | |
| Elder Ray (13): | -1.85 | |
| Super Trend (3,10): | 78.03 | |
| Zig ZAG (10): | 80.84 | |
| VORTEX (21): | 1.0000 | |
| Stochastique (14,3,5): | 41.83 | |
| TEMA (21): | 84.14 | |
| Williams %R (14): | -78.94 | |
| Chande Momentum Oscillator (20): | -2.08 | |
| Repulse (5,40,3): | -5.7300 | |
| ROCnROLL: | 2 | |
| TRIX (15,9): | 0.1700 | |
| Courbe Coppock: | 7.21 |
| MA7: | 84.35 | |
| MA20: | 82.77 | |
| MA50: | 81.04 | |
| MA100: | 81.88 | |
| MAexp7: | 83.33 | |
| MAexp20: | 82.97 | |
| MAexp50: | 82.36 | |
| MAexp100: | 85.73 | |
| Price / MA7: | -4.16% | |
| Price / MA20: | -2.33% | |
| Price / MA50: | -0.25% | |
| Price / MA100: | -1.27% | |
| Price / MAexp7: | -2.99% | |
| Price / MAexp20: | -2.57% | |
| Price / MAexp50: | -1.85% | |
| Price / MAexp100: | -5.70% |
News
Don"t forget to follow the news on UNITED THERAPEUTICS. At the time of publication of this analysis, the latest news was as follows:
- Correvio Highlights FDA Acceptance of United Therapeutics' Trevyent New Drug Application
- United Therapeutics Announces FDA Acceptance Of Trevyent New Drug Application For Review
- United Therapeutics Corporation To Present At 2019 Wedbush PacGrow Healthcare Conference
- United Therapeutics Corporation Reports Second Quarter 2019 Financial Results
- United Therapeutics Corporation To Report Second Quarter 2019 Financial Results Before The Market Opens On Wednesday, July 31, 2019
About author

Online


Add a comment
Comments
0 comments on the analysis UNITED THERAPEUTICS - Daily