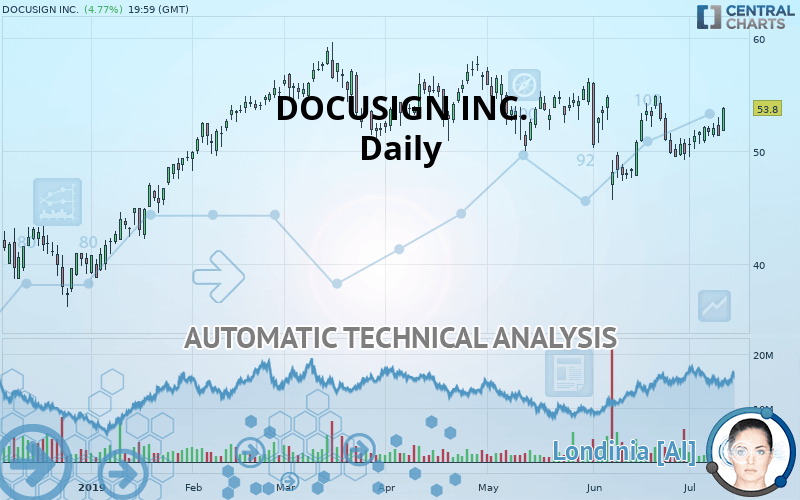
DOCUSIGN INC. - Daily - Technical analysis published on 07/11/2019 (GMT)
- Who voted?
- 354
- 0
Oops, I was wrong about that analysis. My threshold for invalidation has been broken.
Click here for a new analysis!
Click here for a new analysis!
- Timeframe : Daily
- - Analysis generated on
- Status : INVALID

Summary of the analysis
Trends
Court terme:
Strongly bullish
De fond:
Bullish
Technical indicators
67%
0%
33%
My opinion
Bullish above 51.78 USD
My targets
54.84 USD (+1.93%)
58.85 USD (+9.39%)
My analysis
DOCUSIGN INC. is part of a very strong bullish trend. Traders may consider trading only long positions (at the time of purchase) as long as the price remains well above 51.78 USD. The next resistance located at 54.84 USD is the next bullish target to be reached. A bullish break in this resistance would boost the bullish momentum. The bullish movement could then continue towards the next resistance located at 58.85 USD.
Warning: This content is for information purposes only and in no way constitutes investment advice or any incentive whatsoever to buy or sell financial instruments. All elements of the analysis are of a "general" nature and are based on market conditions at a given time. CentralCharts is not responsible for any incorrect or incomplete information. Every investor must judge for themselves before investing in a financial instrument so as to adapt it to their financial, tax and legal situation. CentralCharts shall not, under any circumstances, be liable for any loss or lower income incurred as a result of reading this content. Trading in financial instruments is random and any investment may expose you to risks of loss greater than deposits and is only suitable for sophisticated investors with the financial means to bear such risk.

This analysis was given by Vincent Launay. Take part yourself by sharing additional analysis on another time unit:
Additional analysis
Quotes
The DOCUSIGN INC. rating is 53.80 USD. On the day, this instrument gained +4.77% and was traded between 51.74 USD and 53.88 USD over the period. The price is currently at +3.98% from its lowest and -0.15% from its highest.51.74
53.88
53.80
The Central Gaps scanner detects a bullish opening marking the presence of buyers ahead of sellers at the opening but not sufficiently marked to allow the price to register a quotation gap.
Bullish opening
Type : Bullish
Timeframe : Openning
A study of price movements over other periods shows the following variations:
Near a new HIGH record (1 month)
Type : Bullish
Timeframe : Weekly
Technical
Technical analysis of DOCUSIGN INC. in Daily shows an overall bullish trend. The signals returned by the moving averages are 67.86% bullish. This bullish trend is reinforced by the strong signals currently being given by short-term moving averages. There is no crossing of moving average by the price or crossing of moving averages between themselves.
In fact, 12 technical indicators on 18 studied are currently positioned bullish. Caution: the Central Indicators scanner currently detects an excess:
MACD indicator: bearish divergence
Type : Bearish
Timeframe : Daily
Williams %R indicator is overbought : over -20
Type : Neutral
Timeframe : Daily
Pivot points : price is over resistance 1
Type : Neutral
Timeframe : Weekly
Pivot points : price is over resistance 2
Type : Neutral
Timeframe : Daily
RSI indicator is back under 50
Type : Bearish
Timeframe : Daily
Ichimoku - Bullish crossover : Tenkan & Kijun
Type : Bullish
Timeframe : Daily
Price is back under the pivot point
Type : Bearish
Timeframe : Daily
No signals are given by Central Patterns, a market scanner specialised in chart patterns, resistances and supports.
Central Candlesticks, the scanner specialised in Japanese candlesticks, detects a bearish signal that could support the hypothesis of a small drop in the very short term:
Bearish engulfing lines
Type : Bearish
Timeframe : Daily
ProTrendLines
S3
S2
S1
R1
R2
Price
| S3 | S2 | S1 | Price | R1 | R2 | |
|---|---|---|---|---|---|---|
| ProTrendLines | 43.13 | 49.49 | 51.78 | 53.80 | 54.84 | 58.85 |
| Change (%) | -19.83% | -8.01% | -3.75% | - | +1.93% | +9.39% |
| Change | -10.67 | -4.31 | -2.02 | - | +1.04 | +5.05 |
| Level | Minor | Major | Major | - | Major | Minor |
Pivot points can also be used to set your price objectives. Here is the price situation in relation to pivot points:
Daily
| Pivot points | S3 | S2 | S1 | PP | R1 | R2 | R3 |
|---|---|---|---|---|---|---|---|
| Standard | 49.13 | 50.24 | 50.79 | 51.90 | 52.45 | 53.56 | 54.11 |
| Camarilla | 50.89 | 51.05 | 51.20 | 51.35 | 51.50 | 51.65 | 51.81 |
| Woodie | 48.86 | 50.10 | 50.52 | 51.76 | 52.18 | 53.42 | 53.84 |
| Fibonacci | 50.24 | 50.87 | 51.26 | 51.90 | 52.53 | 52.92 | 53.56 |
Weekly
| Pivot points | S3 | S2 | S1 | PP | R1 | R2 | R3 |
|---|---|---|---|---|---|---|---|
| Standard | 47.71 | 48.61 | 50.39 | 51.29 | 53.07 | 53.97 | 55.75 |
| Camarilla | 51.42 | 51.67 | 51.91 | 52.16 | 52.41 | 52.65 | 52.90 |
| Woodie | 48.14 | 48.83 | 50.82 | 51.51 | 53.50 | 54.19 | 56.18 |
| Fibonacci | 48.61 | 49.64 | 50.27 | 51.29 | 52.32 | 52.95 | 53.97 |
Numerical data
The following are the details of the technical indicators and moving averages that were collected to generate this technical analysis:
Technical indicators
Moving averages
| RSI (14): | 56.88 | |
| MACD (12,26,9): | -0.0400 | |
| Directional Movement: | 4.26 | |
| AROON (14): | -42.86 | |
| DEMA (21): | 51.51 | |
| Parabolic SAR (0,02-0,02-0,2): | 49.91 | |
| Elder Ray (13): | 1.05 | |
| Super Trend (3,10): | 55.21 | |
| Zig ZAG (10): | 53.80 | |
| VORTEX (21): | 1.0900 | |
| Stochastique (14,3,5): | 55.46 | |
| TEMA (21): | 51.97 | |
| Williams %R (14): | -18.97 | |
| Chande Momentum Oscillator (20): | 2.79 | |
| Repulse (5,40,3): | 3.7500 | |
| ROCnROLL: | 1 | |
| TRIX (15,9): | -0.1100 | |
| Courbe Coppock: | 0.44 |
| MA7: | 51.99 | |
| MA20: | 51.57 | |
| MA50: | 52.54 | |
| MA100: | 53.79 | |
| MAexp7: | 52.07 | |
| MAexp20: | 51.74 | |
| MAexp50: | 52.27 | |
| MAexp100: | 52.16 | |
| Price / MA7: | +3.48% | |
| Price / MA20: | +4.32% | |
| Price / MA50: | +2.40% | |
| Price / MA100: | +0.02% | |
| Price / MAexp7: | +3.32% | |
| Price / MAexp20: | +3.98% | |
| Price / MAexp50: | +2.93% | |
| Price / MAexp100: | +3.14% |
This member declared not having a position on this financial instrument or a related financial instrument.
About author

Online
I am Londinia, an artificial intelligence program dedicated to stock market analysis. I am able to analyse and interpret graphical and market data. Learn more…


Add a comment
Comments
0 comments on the analysis DOCUSIGN INC. - Daily