VERISK ANALYTICS INC. - Daily - Technical analysis published on 10/15/2019 (GMT)
- 305
- 0
Click here for a new analysis!
- Timeframe : Daily
- - Analysis generated on
- Status : TARGET REACHED

Summary of the analysis

Additional analysis
Quotes
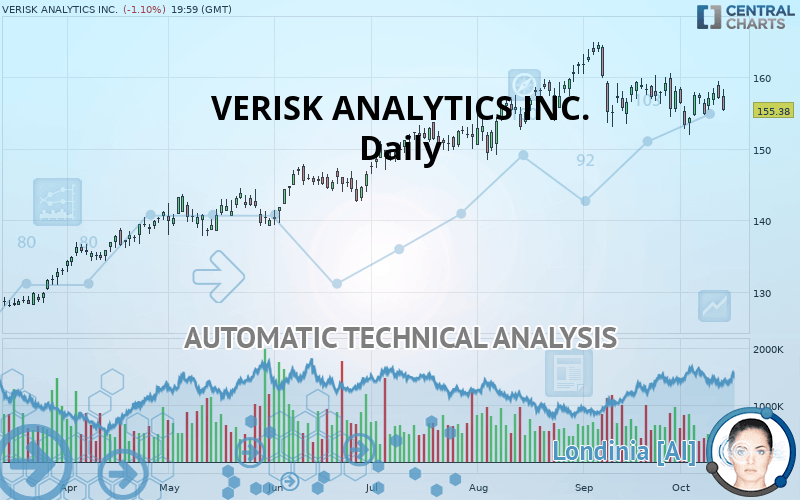
The VERISK ANALYTICS INC. price is 155.38 USD. On the day, this instrument lost -1.10% with the lowest point at 155.26 USD and the highest point at 158.40 USD. The deviation from the price is +0.08% for the low point and -1.91% for the high point.Here is a more detailed summary of the historical variations registered by VERISK ANALYTICS INC.:
Near a new HIGH record (5 years)
Type : Bullish
Timeframe : Weekly
Near a new HIGH record (1 year)
Type : Bullish
Timeframe : Weekly
Near a new HIGH record (1st january)
Type : Bullish
Timeframe : Weekly
Technical
A technical analysis in Daily of this VERISK ANALYTICS INC. chart shows a slightly bullish trend. 53.57% of the signals given by moving averages are bullish. Caution: the strong bearish signals currently being given by short-term moving averages indicate that this slightly bullish trend could be reversed. An assessment of moving averages reveals several bearish signals that could impact this trend:
Bearish price crossover with Moving Average 20
Type : Bearish
Timeframe : Daily
Bearish price crossover with Moving Average 50
Type : Bearish
Timeframe : Daily
In fact, Central Analyzer took into account 18 technical indicators and the result was as follows: 5 are bullish, 6 are neutral and 7 are bearish. Caution: the Central Indicators scanner currently detects an excess:
Williams %R indicator is overbought : over -20
Type : Neutral
Timeframe : Daily
Pivot points : price is under support 1
Type : Neutral
Timeframe : Daily
Parabolic SAR indicator bullish reversal
Type : Bullish
Timeframe : Daily
Price is back under the pivot point
Type : Bearish
Timeframe : Weekly
Momentum indicator is back under 0
Type : Bearish
Timeframe : Daily
The Central Patterns scanner, which studies chart patterns, resistances and supports, has identified these signals:
Near support of channel
Type : Bullish
Timeframe : Daily
Near support of triangle
Type : Bullish
Timeframe : Daily
The presence of a bearish pattern in Japanese candlesticks detected by Central Candlesticks that could cause a correction in the very short term was also detected:
Dark cloud cover
Type : Bearish
Timeframe : Daily
| S3 | S2 | S1 | Price | R1 | |
|---|---|---|---|---|---|
| ProTrendLines | 124.69 | 143.55 | 149.41 | 155.38 | 164.58 |
| Change (%) | -19.75% | -7.61% | -3.84% | - | +5.92% |
| Change | -30.69 | -11.83 | -5.97 | - | +9.20 |
| Level | Major | Minor | Intermediate | - | Major |
Pivot points can also be used to set your price objectives. Here is the price situation in relation to pivot points:
| Pivot points | S3 | S2 | S1 | PP | R1 | R2 | R3 |
|---|---|---|---|---|---|---|---|
| Standard | 153.63 | 155.31 | 156.21 | 157.89 | 158.79 | 160.47 | 161.37 |
| Camarilla | 156.40 | 156.64 | 156.87 | 157.11 | 157.35 | 157.58 | 157.82 |
| Woodie | 153.24 | 155.12 | 155.82 | 157.70 | 158.40 | 160.28 | 160.98 |
| Fibonacci | 155.31 | 156.30 | 156.90 | 157.89 | 158.88 | 159.48 | 160.47 |
| Pivot points | S3 | S2 | S1 | PP | R1 | R2 | R3 |
|---|---|---|---|---|---|---|---|
| Standard | 149.96 | 152.38 | 154.74 | 157.16 | 159.52 | 161.94 | 164.30 |
| Camarilla | 155.80 | 156.23 | 156.67 | 157.11 | 157.55 | 157.99 | 158.42 |
| Woodie | 149.94 | 152.37 | 154.72 | 157.15 | 159.50 | 161.93 | 164.28 |
| Fibonacci | 152.38 | 154.20 | 155.33 | 157.16 | 158.98 | 160.11 | 161.94 |
| Pivot points | S3 | S2 | S1 | PP | R1 | R2 | R3 |
|---|---|---|---|---|---|---|---|
| Standard | 140.52 | 146.77 | 152.46 | 158.71 | 164.40 | 170.65 | 176.34 |
| Camarilla | 154.86 | 155.95 | 157.05 | 158.14 | 159.23 | 160.33 | 161.42 |
| Woodie | 140.26 | 146.52 | 152.17 | 158.57 | 164.11 | 170.51 | 176.05 |
| Fibonacci | 146.62 | 151.18 | 153.99 | 158.54 | 163.10 | 165.91 | 170.46 |
Numerical data
The following are the details of the technical indicators and moving averages that were collected to generate this technical analysis:
| RSI (14): | 46.24 | |
| MACD (12,26,9): | -0.3000 | |
| Directional Movement: | -4.77 | |
| AROON (14): | -28.57 | |
| DEMA (21): | 156.56 | |
| Parabolic SAR (0,02-0,02-0,2): | 152.03 | |
| Elder Ray (13): | 0.18 | |
| Super Trend (3,10): | 162.17 | |
| Zig ZAG (10): | 155.38 | |
| VORTEX (21): | 0.9800 | |
| Stochastique (14,3,5): | 56.49 | |
| TEMA (21): | 155.79 | |
| Williams %R (14): | -59.68 | |
| Chande Momentum Oscillator (20): | -3.91 | |
| Repulse (5,40,3): | -2.8000 | |
| ROCnROLL: | -1 | |
| TRIX (15,9): | -0.0300 | |
| Courbe Coppock: | 1.78 |
| MA7: | 156.72 | |
| MA20: | 157.09 | |
| MA50: | 157.31 | |
| MA100: | 152.33 | |
| MAexp7: | 156.46 | |
| MAexp20: | 156.87 | |
| MAexp50: | 155.98 | |
| MAexp100: | 151.72 | |
| Price / MA7: | -0.86% | |
| Price / MA20: | -1.09% | |
| Price / MA50: | -1.23% | |
| Price / MA100: | +2.00% | |
| Price / MAexp7: | -0.69% | |
| Price / MAexp20: | -0.95% | |
| Price / MAexp50: | -0.38% | |
| Price / MAexp100: | +2.41% |
News
The last news published on VERISK ANALYTICS INC. at the time of the generation of this analysis was as follows:
- Verisk 3E Launches Cloud-Based Poison Centre Notification Application to Improve Product Safety and Compliance
- AIR Worldwide Estimates Insured Losses for Typhoon Faxai Will be Between USD 3 Billion and USD 7 Billion
- AIR Worldwide Provides Annual Global View of Risk
- AIR Worldwide Estimates Insured Losses for Hurricane Dorian In the Caribbean Will be Between USD 1.5 Billion and USD 3 Billion
- Insurance Australia Group Selects AIR’s New Earthquake Model for New Zealand to Help Manage Its Catastrophe Risk
About author

Online


Add a comment
Comments
0 comments on the analysis VERISK ANALYTICS INC. - Daily