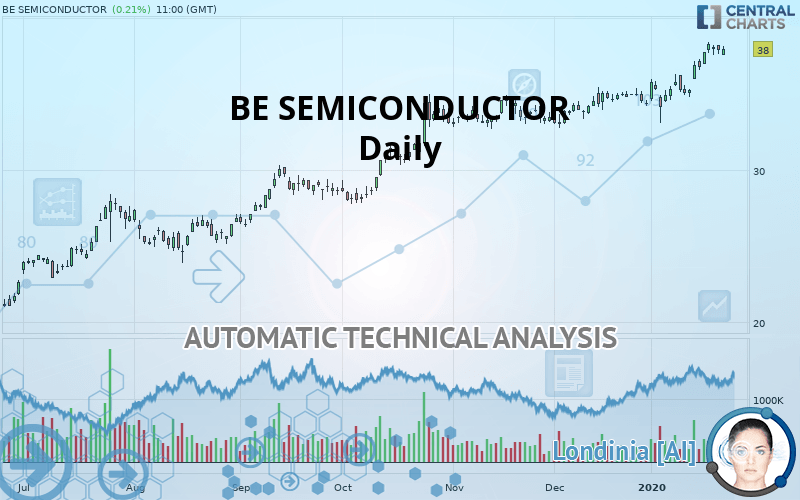
BE SEMICONDUCTOR - Daily - Technical analysis published on 01/23/2020 (GMT)
- Who voted?
- 282
- 0
Click here for a new analysis!
- Timeframe : Daily
- - Analysis generated on
- Status : TARGET REACHED

Summary of the analysis

Additional analysis
Quotes
The BE SEMICONDUCTOR rating is 38.00 EUR. The price has increased by +0.21% since the last closing with the lowest point at 37.59 EUR and the highest point at 38.16 EUR. The deviation from the price is +1.09% for the low point and -0.42% for the high point.The Central Gaps scanner detects the formation of a bearish gap marking the strong presence of sellers ahead of buyers at the opening. This formed a quotation gap.
Opening Gap DOWN
Type : Bearish
Timeframe : Openning
Here is a more detailed summary of the historical variations registered by BE SEMICONDUCTOR:
Near a new HIGH record (5 years)
Type : Bullish
Timeframe : Weekly
Near a new HIGH record (1st january)
Type : Bullish
Timeframe : Weekly
Near a new HIGH record (1 month)
Type : Bullish
Timeframe : Weekly
Technical
A technical analysis in Daily of this BE SEMICONDUCTOR chart shows a strongly bullish trend. 92.86% of the signals given by moving averages are bullish. This strongly bullish trend is supported by the strong bullish signals given by short-term moving averages. The Central Indicators scanner does not detect any result on moving averages that would impact this trend.
Technical indicators are strongly bullish, suggesting that the price increase should continue.
But beware of excesses. The Central Indicators scanner currently detects this:
CCI indicator is overbought : over 100
Type : Neutral
Timeframe : Daily
Williams %R indicator is overbought : over -20
Type : Neutral
Timeframe : Daily
Price is back over the pivot point
Type : Bullish
Timeframe : Weekly
Price is back under the pivot point
Type : Bearish
Timeframe : Daily
An analysis of the price chart with the Central Patterns scanner (detector of chart patterns and resistances and supports) shows several results that can have an impact on the price change:
Near horizontal resistance
Type : Bearish
Timeframe : Daily
Resistance of channel is broken
Type : Bullish
Timeframe : Daily
For a small setback in the very short term, the Central Candlesticks scanner currently notes the presence of this bearish pattern in Japanese candlesticks:
Bearish engulfing lines
Type : Bearish
Timeframe : Daily
| S3 | S2 | S1 | Price | R1 | R2 | |
|---|---|---|---|---|---|---|
| ProTrendLines | 28.16 | 33.04 | 34.64 | 38.00 | 40.95 | 44.55 |
| Change (%) | -25.89% | -13.05% | -8.84% | - | +7.76% | +17.24% |
| Change | -9.84 | -4.96 | -3.36 | - | +2.95 | +6.55 |
| Level | Major | Major | Major | - | Minor | Major |
Pivot points can also be used to set your price objectives. Here is the price situation in relation to pivot points:
| Pivot points | S3 | S2 | S1 | PP | R1 | R2 | R3 |
|---|---|---|---|---|---|---|---|
| Standard | 37.03 | 37.34 | 37.63 | 37.94 | 38.23 | 38.54 | 38.83 |
| Camarilla | 37.76 | 37.81 | 37.87 | 37.92 | 37.98 | 38.03 | 38.09 |
| Woodie | 37.02 | 37.34 | 37.62 | 37.94 | 38.22 | 38.54 | 38.82 |
| Fibonacci | 37.34 | 37.57 | 37.71 | 37.94 | 38.17 | 38.31 | 38.54 |
| Pivot points | S3 | S2 | S1 | PP | R1 | R2 | R3 |
|---|---|---|---|---|---|---|---|
| Standard | 32.81 | 33.81 | 35.79 | 36.79 | 38.77 | 39.77 | 41.75 |
| Camarilla | 36.96 | 37.23 | 37.51 | 37.78 | 38.05 | 38.33 | 38.60 |
| Woodie | 33.31 | 34.06 | 36.29 | 37.04 | 39.27 | 40.02 | 42.25 |
| Fibonacci | 33.81 | 34.95 | 35.65 | 36.79 | 37.93 | 38.63 | 39.77 |
| Pivot points | S3 | S2 | S1 | PP | R1 | R2 | R3 |
|---|---|---|---|---|---|---|---|
| Standard | 30.27 | 31.53 | 32.99 | 34.25 | 35.71 | 36.97 | 38.43 |
| Camarilla | 33.71 | 33.96 | 34.21 | 34.46 | 34.71 | 34.96 | 35.21 |
| Woodie | 30.38 | 31.58 | 33.10 | 34.30 | 35.82 | 37.02 | 38.54 |
| Fibonacci | 31.53 | 32.57 | 33.21 | 34.25 | 35.29 | 35.93 | 36.97 |
Numerical data
The following is the status of the technical indicators and moving averages at the time of publication of this technical analysis:
| RSI (14): | 68.63 | |
| MACD (12,26,9): | 0.9800 | |
| Directional Movement: | 16.40 | |
| AROON (14): | 71.43 | |
| DEMA (21): | 37.55 | |
| Parabolic SAR (0,02-0,02-0,2): | 35.27 | |
| Elder Ray (13): | 0.98 | |
| Super Trend (3,10): | 35.36 | |
| Zig ZAG (10): | 38.04 | |
| VORTEX (21): | 1.0600 | |
| Stochastique (14,3,5): | 92.03 | |
| TEMA (21): | 37.98 | |
| Williams %R (14): | -7.53 | |
| Chande Momentum Oscillator (20): | 3.03 | |
| Repulse (5,40,3): | 2.2400 | |
| ROCnROLL: | 1 | |
| TRIX (15,9): | 0.2900 | |
| Courbe Coppock: | 14.40 |
| MA7: | 37.71 | |
| MA20: | 36.01 | |
| MA50: | 34.85 | |
| MA100: | 32.60 | |
| MAexp7: | 37.54 | |
| MAexp20: | 36.37 | |
| MAexp50: | 34.86 | |
| MAexp100: | 32.70 | |
| Price / MA7: | +0.77% | |
| Price / MA20: | +5.53% | |
| Price / MA50: | +9.04% | |
| Price / MA100: | +16.56% | |
| Price / MAexp7: | +1.23% | |
| Price / MAexp20: | +4.48% | |
| Price / MAexp50: | +9.01% | |
| Price / MAexp100: | +16.21% |
News
Don"t forget to follow the news on BE SEMICONDUCTOR. At the time of publication of this analysis, the latest news was as follows:
- Strong Q4-17 Results. Revenue and Net Income of € 153.2 Million and € 43.6 Million Up 64.6% and 161.1%, Respectively, vs. Q4-16. Orders of € 149.4 Million Up 63.5% vs. Q4-16
- Besi Posts Strong Q3-17 and YTD-17 Results
- Besi Posts Strong Q2-17 and H1-17 Results
- Besi Reports Q1-17 Revenue of € 110.2 Million and Net Income of € 24.3 Million
-
 BE Semiconductor Inds
About author

Online


Add a comment
Comments
0 comments on the analysis BE SEMICONDUCTOR - Daily