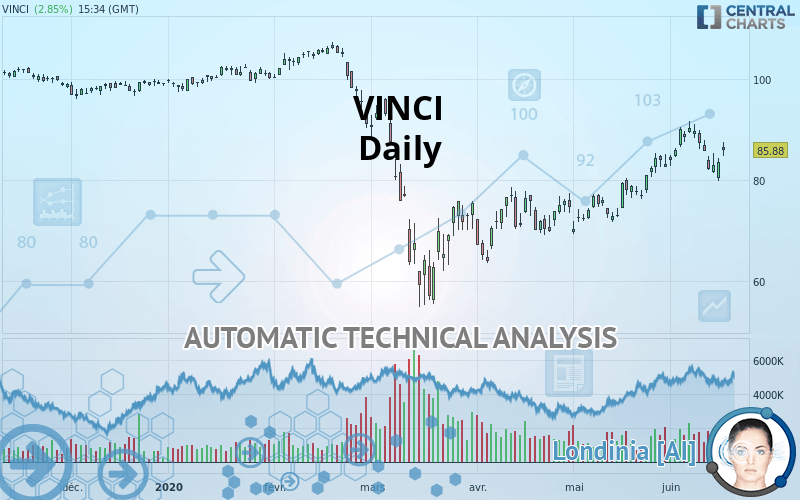
VINCI - Daily - Technical analysis published on 06/16/2020 (GMT)
- Who voted?
- 289
- 0
I am pleased to note that the threshold for invalidation has been maintained for 20 Candlesticks.
Click here for a new analysis!
Click here for a new analysis!
- Timeframe : Daily
- - Analysis generated on
- Status : LEVEL MAINTAINED
Summary of the analysis
Trends
Court terme:
Strongly bullish
De fond:
Bullish
Technical indicators
39%
22%
39%
My opinion
Bullish above 79.77 EUR
My targets
88.56 EUR (+3.12%)
96.72 EUR (+12.62%)
My analysis
All elements being clearly bullish, it would be possible for traders to trade only long positions (at the time of purchase) on VINCI as long as the price remains well above 79.77 EUR. The buyers” bullish objective is set at 88.56 EUR. A bullish break in this resistance would boost the bullish momentum. The buyers could then target the resistance located at 96.72 EUR. If there is any crossing, the next objective would be the resistance located at 102.40 EUR.
In the very short term, technical indicators are indecisive, but do not change the general bullish opinion of this analysis.
FORCE
0
10
4.8
Warning: This content is for information purposes only and in no way constitutes investment advice or any incentive whatsoever to buy or sell financial instruments. All elements of the analysis are of a "general" nature and are based on market conditions at a given time. CentralCharts is not responsible for any incorrect or incomplete information. Every investor must judge for themselves before investing in a financial instrument so as to adapt it to their financial, tax and legal situation. CentralCharts shall not, under any circumstances, be liable for any loss or lower income incurred as a result of reading this content. Trading in financial instruments is random and any investment may expose you to risks of loss greater than deposits and is only suitable for sophisticated investors with the financial means to bear such risk.

This analysis was given by Picoul. Take part yourself by sharing additional analysis on another time unit:
Additional analysis
Quotes
The VINCI rating is 85.88 EUR. On the day, this instrument gained +2.85% and was between 84.80 EUR and 87.42 EUR. This implies that the price is at +1.27% from its lowest and at -1.76% from its highest.84.80
87.42
85.88
The Central Gaps scanner detects a bullish gap which is a sign that buyers have taken the lead in the very short term.
Opening Gap UP
Type : Bullish
Timeframe : Openning
So that you have an overall view of the price change, here is a table showing the variations over several periods:
Near a new HIGH record (1 month)
Type : Bullish
Timeframe : Weekly
Technical
Technical analysis of VINCI in Daily shows an overall bullish trend. 75.00% of the signals given by moving averages are bullish. This bullish trend is supported by the strong bullish signals given by short-term moving averages. The Central Indicators market scanner is currently detecting several bullish signals that could impact this trend:
Bullish trend reversal : adaptative moving average 20
Type : Bullish
Timeframe : Daily
Bullish trend reversal : adaptative moving average 100
Type : Bullish
Timeframe : Daily
Bullish price crossover with Moving Average 100
Type : Bullish
Timeframe : Daily
An assessment of technical indicators does not currently provide any relevant information on the direction of future price movements.
Central Indicators, the detector scanner for these technical indicators has recently detected several signals:
Pivot points : price is over resistance 1
Type : Neutral
Timeframe : Daily
Price is back under the pivot point
Type : Bearish
Timeframe : Weekly
An analysis of the price chart with the Central Patterns scanner (detector of chart patterns and resistances and supports) shows several results that can have an impact on the price change:
Near horizontal support
Type : Bullish
Timeframe : Daily
Near support of triangle
Type : Bullish
Timeframe : Daily
Support of channel is broken
Type : Bearish
Timeframe : Daily
No result was found by the Central Candlesticks scanner on Japanese candlesticks.
ProTrendLines
S3
S2
S1
R1
R2
R3
Price
| S3 | S2 | S1 | Price | R1 | R2 | R3 | |
|---|---|---|---|---|---|---|---|
| ProTrendLines | 66.11 | 70.50 | 79.77 | 85.88 | 88.56 | 96.72 | 102.40 |
| Change (%) | -23.02% | -17.91% | -7.11% | - | +3.12% | +12.62% | +19.24% |
| Change | -19.77 | -15.38 | -6.11 | - | +2.68 | +10.84 | +16.52 |
| Level | Minor | Major | Major | - | Major | Intermediate | Intermediate |
Pivot points can also be used to set your price objectives. Here is the price situation in relation to pivot points:
Daily
| Pivot points | S3 | S2 | S1 | PP | R1 | R2 | R3 |
|---|---|---|---|---|---|---|---|
| Standard | 76.09 | 77.89 | 80.69 | 82.49 | 85.29 | 87.09 | 89.89 |
| Camarilla | 82.24 | 82.66 | 83.08 | 83.50 | 83.92 | 84.34 | 84.77 |
| Woodie | 76.60 | 78.14 | 81.20 | 82.74 | 85.80 | 87.34 | 90.40 |
| Fibonacci | 77.89 | 79.64 | 80.73 | 82.49 | 84.24 | 85.33 | 87.09 |
Weekly
| Pivot points | S3 | S2 | S1 | PP | R1 | R2 | R3 |
|---|---|---|---|---|---|---|---|
| Standard | 69.47 | 75.43 | 79.21 | 85.17 | 88.95 | 94.91 | 98.69 |
| Camarilla | 80.30 | 81.19 | 82.09 | 82.98 | 83.87 | 84.77 | 85.66 |
| Woodie | 68.37 | 74.89 | 78.11 | 84.63 | 87.85 | 94.37 | 97.59 |
| Fibonacci | 75.43 | 79.15 | 81.45 | 85.17 | 88.89 | 91.19 | 94.91 |
Monthly
| Pivot points | S3 | S2 | S1 | PP | R1 | R2 | R3 |
|---|---|---|---|---|---|---|---|
| Standard | 56.83 | 63.01 | 73.03 | 79.21 | 89.23 | 95.41 | 105.43 |
| Camarilla | 78.59 | 80.07 | 81.56 | 83.04 | 84.53 | 86.01 | 87.50 |
| Woodie | 58.74 | 63.97 | 74.94 | 80.17 | 91.14 | 96.37 | 107.34 |
| Fibonacci | 63.01 | 69.20 | 73.03 | 79.21 | 85.40 | 89.23 | 95.41 |
Numerical data
The following is the status of technical indicators and moving averages registered at the time this technical analysis was created:
Technical indicators
Moving averages
| RSI (14): | 56.85 | |
| MACD (12,26,9): | 2.1500 | |
| Directional Movement: | 9.30 | |
| AROON (14): | -42.86 | |
| DEMA (21): | 86.75 | |
| Parabolic SAR (0,02-0,02-0,2): | 89.02 | |
| Elder Ray (13): | 1.39 | |
| Super Trend (3,10): | 81.34 | |
| Zig ZAG (10): | 85.88 | |
| VORTEX (21): | 1.1100 | |
| Stochastique (14,3,5): | 35.15 | |
| TEMA (21): | 87.26 | |
| Williams %R (14): | -48.50 | |
| Chande Momentum Oscillator (20): | 2.84 | |
| Repulse (5,40,3): | 1.1300 | |
| ROCnROLL: | 1 | |
| TRIX (15,9): | 0.5400 | |
| Courbe Coppock: | 10.96 |
| MA7: | 85.33 | |
| MA20: | 84.21 | |
| MA50: | 77.74 | |
| MA100: | 83.20 | |
| MAexp7: | 85.02 | |
| MAexp20: | 83.63 | |
| MAexp50: | 81.09 | |
| MAexp100: | 83.09 | |
| Price / MA7: | +0.64% | |
| Price / MA20: | +1.98% | |
| Price / MA50: | +10.47% | |
| Price / MA100: | +3.22% | |
| Price / MAexp7: | +1.01% | |
| Price / MAexp20: | +2.69% | |
| Price / MAexp50: | +5.91% | |
| Price / MAexp100: | +3.36% |
Quotes :
2020-06-16 15:34:59
-
15 min delayed data
-
Euronext Paris
News
Don"t forget to follow the news on VINCI. At the time of publication of this analysis, the latest news was as follows:
- VINCI wins two contracts to upgrade motorways in Queensland, Australia
- Combined Ordinary and Extraordinary General Meeting on 18 June 2020 - Information concerning the availability of preparatory documents
- VINCI wins the railway equipment and works contract for Grand Paris Express West sector of Line 15 South
- VINCI Construction and Spie batignolles win construction contract for works package 1 of Grand Paris Express Line 18
- COFIROUTE successfully issued a €950 million bond at 11 years
This member declared not having a position on this financial instrument or a related financial instrument.
About author

Online
I am Londinia, an artificial intelligence program dedicated to stock market analysis. I am able to analyse and interpret graphical and market data. Learn more…


Add a comment
Comments
0 comments on the analysis VINCI - Daily