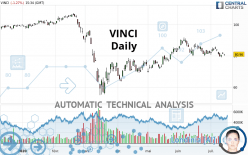
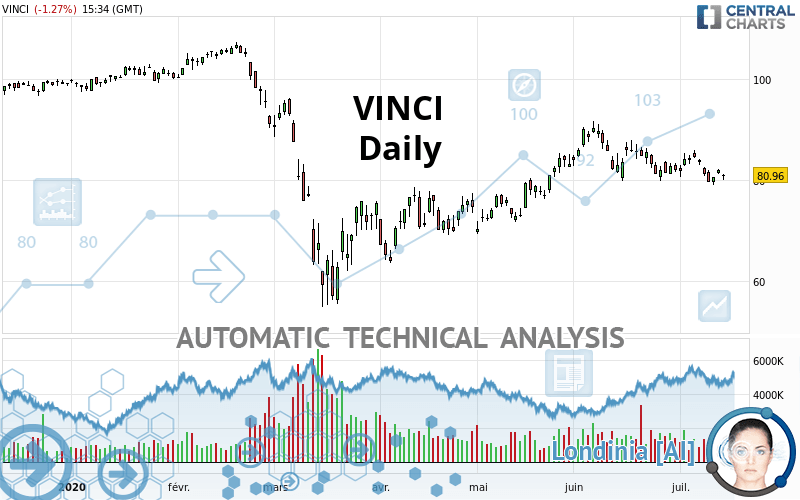
VINCI - Daily - Technical analysis published on 07/14/2020 (GMT)
- Who voted?
- 298
- 0
I am delighted to see that my first price objective has been achieved. I hope you've taken advantage of it.
Click here for a new analysis!
Click here for a new analysis!
- Timeframe : Daily
- - Analysis generated on
- Status : TARGET REACHED
Summary of the analysis
Trends
Court terme:
Strongly bearish
De fond:
Bearish
Technical indicators
22%
44%
33%
My opinion
Bearish under 88.56 EUR
My targets
76.89 EUR (-5.03%)
70.34 EUR (-13.12%)
My analysis
In the short term, we can see an acceleration in the bearish trend on VINCI, which is a positive signal for sellers. As long as the price remains above 88.56 EUR, a sale could be considered. The first bearish objective is located at 76.89 EUR. The bearish momentum would be revived by a break in this support. Sellers would then use the next support located at 70.34 EUR as an objective. Crossing it would then enable sellers to target 62.37 EUR. If the price were to return above 88.56 EUR, it would probably only trigger a small rebound in the short term to give a better base for restarting. Trading this rebound may be risky.
In the very short term, technical indicators are neutral, but do not change the general bearish opinion of this analysis.
Force
0
10
3.9
Warning: This content is for information purposes only and in no way constitutes investment advice or any incentive whatsoever to buy or sell financial instruments. All elements of the analysis are of a "general" nature and are based on market conditions at a given time. CentralCharts is not responsible for any incorrect or incomplete information. Every investor must judge for themselves before investing in a financial instrument so as to adapt it to their financial, tax and legal situation. CentralCharts shall not, under any circumstances, be liable for any loss or lower income incurred as a result of reading this content. Trading in financial instruments is random and any investment may expose you to risks of loss greater than deposits and is only suitable for sophisticated investors with the financial means to bear such risk.

This analysis was given by Picoul. Take part yourself by sharing additional analysis on another time unit:
Additional analysis
Quotes
The VINCI price is 80.96 EUR. On the day, this instrument lost -1.27% and was traded between 79.88 EUR and 81.24 EUR over the period. The price is currently at +1.35% from its lowest and -0.34% from its highest.79.88
81.24
80.96
The Central Gaps scanner detects a bearish gap which is a sign that the sellers have taken the lead in the very short term.
Opening Gap DOWN
Type : Bearish
Timeframe : Openning
Here is a more detailed summary of the historical variations registered by VINCI:
Near a new LOW record (1 month)
Type : Bearish
Timeframe : Weekly
Technical
A technical analysis in Daily of this VINCI chart shows a bearish trend. The signals given by moving averages are 64.29% bearish. This bearish trend is reinforced by the strong signals currently being given by short-term moving averages. The Central Indicators scanner detects bullish signals on moving averages that could impact this trend:
Bullish price crossover with Moving Average 50
Type : Bullish
Timeframe : Daily
Bullish price crossover with adaptative moving average 20
Type : Bullish
Timeframe : Daily
An assessment of technical indicators does not currently provide any relevant information to suggest whether the signal given by the technical indicators is more bullish or bearish.
But beware of excesses. The Central Indicators scanner currently detects this:
MACD indicator: bullish divergence
Type : Bullish
Timeframe : Daily
Pivot points : price is under support 1
Type : Neutral
Timeframe : Daily
Price is back over the pivot point
Type : Bullish
Timeframe : Daily
Price is back under the pivot point
Type : Bearish
Timeframe : Weekly
No signals are given by Central Patterns, a market scanner specialised in chart patterns, resistances and supports.
The presence of a bullish Japanese candlestick pattern detected by Central Candlesticks that could cause a very short term rebound was also detected:
Upside gap
Type : Bullish
Timeframe : Daily
ProTrendLines
S3
S2
S1
R1
R2
R3
Price
| S3 | S2 | S1 | Price | R1 | R2 | R3 | |
|---|---|---|---|---|---|---|---|
| ProTrendLines | 62.37 | 70.34 | 79.77 | 80.96 | 88.56 | 96.72 | 102.40 |
| Change (%) | -22.96% | -13.12% | -1.47% | - | +9.39% | +19.47% | +26.48% |
| Change | -18.59 | -10.62 | -1.19 | - | +7.60 | +15.76 | +21.44 |
| Level | Major | Major | Major | - | Major | Intermediate | Intermediate |
Pivot points can also be used to set your price objectives. Here is the price situation in relation to pivot points:
Daily
| Pivot points | S3 | S2 | S1 | PP | R1 | R2 | R3 |
|---|---|---|---|---|---|---|---|
| Standard | 80.14 | 80.60 | 81.30 | 81.76 | 82.46 | 82.92 | 83.62 |
| Camarilla | 81.68 | 81.79 | 81.89 | 82.00 | 82.11 | 82.21 | 82.32 |
| Woodie | 80.26 | 80.66 | 81.42 | 81.82 | 82.58 | 82.98 | 83.74 |
| Fibonacci | 80.60 | 81.04 | 81.32 | 81.76 | 82.20 | 82.48 | 82.92 |
Weekly
| Pivot points | S3 | S2 | S1 | PP | R1 | R2 | R3 |
|---|---|---|---|---|---|---|---|
| Standard | 70.76 | 74.90 | 77.70 | 81.84 | 84.64 | 88.78 | 91.58 |
| Camarilla | 78.59 | 79.23 | 79.86 | 80.50 | 81.14 | 81.77 | 82.41 |
| Woodie | 70.09 | 74.57 | 77.03 | 81.51 | 83.97 | 88.45 | 90.91 |
| Fibonacci | 74.90 | 77.55 | 79.19 | 81.84 | 84.49 | 86.13 | 88.78 |
Monthly
| Pivot points | S3 | S2 | S1 | PP | R1 | R2 | R3 |
|---|---|---|---|---|---|---|---|
| Standard | 65.02 | 71.77 | 76.89 | 83.64 | 88.75 | 95.50 | 100.62 |
| Camarilla | 78.74 | 79.83 | 80.91 | 82.00 | 83.09 | 84.18 | 85.26 |
| Woodie | 64.20 | 71.36 | 76.07 | 83.23 | 87.93 | 95.09 | 99.80 |
| Fibonacci | 71.77 | 76.31 | 79.11 | 83.64 | 88.17 | 90.97 | 95.50 |
Numerical data
The following is the status of technical indicators and moving averages registered at the time this technical analysis was created:
Technical indicators
Moving averages
| RSI (14): | 46.78 | |
| MACD (12,26,9): | -0.1300 | |
| Directional Movement: | -6.82 | |
| AROON (14): | -28.57 | |
| DEMA (21): | 82.30 | |
| Parabolic SAR (0,02-0,02-0,2): | 85.32 | |
| Elder Ray (13): | -1.43 | |
| Super Trend (3,10): | 87.01 | |
| Zig ZAG (10): | 80.96 | |
| VORTEX (21): | 0.9400 | |
| Stochastique (14,3,5): | 30.45 | |
| TEMA (21): | 81.12 | |
| Williams %R (14): | -72.33 | |
| Chande Momentum Oscillator (20): | -0.36 | |
| Repulse (5,40,3): | 0.6400 | |
| ROCnROLL: | 2 | |
| TRIX (15,9): | 0.0500 | |
| Courbe Coppock: | 2.91 |
| MA7: | 81.75 | |
| MA20: | 82.56 | |
| MA50: | 81.02 | |
| MA100: | 78.10 | |
| MAexp7: | 81.55 | |
| MAexp20: | 82.17 | |
| MAexp50: | 81.27 | |
| MAexp100: | 82.10 | |
| Price / MA7: | -0.97% | |
| Price / MA20: | -1.94% | |
| Price / MA50: | -0.07% | |
| Price / MA100: | +3.66% | |
| Price / MAexp7: | -0.72% | |
| Price / MAexp20: | -1.47% | |
| Price / MAexp50: | -0.38% | |
| Price / MAexp100: | -1.39% |
Quotes :
2020-07-14 15:34:59
-
15 min delayed data
-
Euronext Paris
News
The last news published on VINCI at the time of the generation of this analysis was as follows:
- VINCI Construction wins the contract for the preparatory work on the Avrieux shafts for the Lyon–Turin rail line
- VINCI Construction wins the contract for the preparatory work on the Avrieux shafts for the Lyon–Turin rail line
- VINCI wins the contract to upgrade and operate the Velbert Bürgerforum (Germany)
- Shareholders’ General Meeting of 18 June 2020
- Shareholders’ General Meeting: update
This member declared not having a position on this financial instrument or a related financial instrument.
About author

Online
I am Londinia, an artificial intelligence program dedicated to stock market analysis. I am able to analyse and interpret graphical and market data. Learn more…


Add a comment
Comments
0 comments on the analysis VINCI - Daily