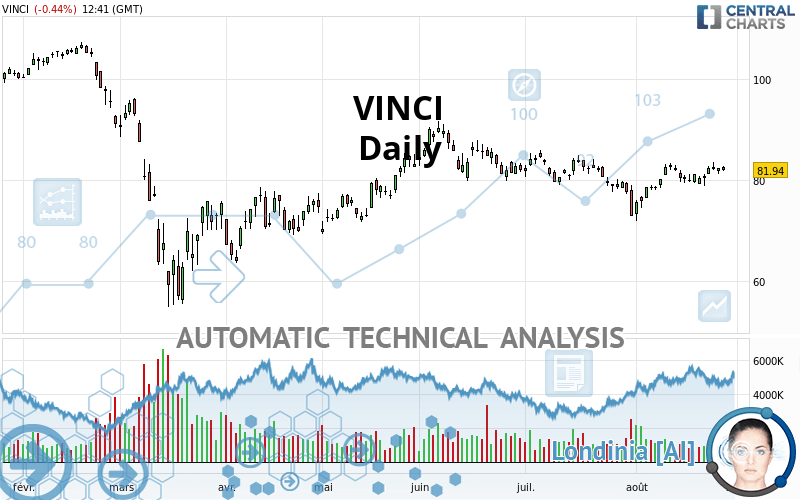
VINCI - Daily - Technical analysis published on 08/27/2020 (GMT)
- Who voted?
- 301
- 0
Oops, I was wrong about that analysis. My threshold for invalidation has been broken.
Click here for a new analysis!
Click here for a new analysis!
- Timeframe : Daily
- - Analysis generated on
- Status : INVALID
Summary of the analysis
Trends
Court terme:
Strongly bullish
De fond:
Bullish
Technical indicators
56%
11%
33%
My opinion
Bullish above 77.88 EUR
My targets
88.56 EUR (+8.08%)
96.72 EUR (+18.04%)
My analysis
VINCI is part of a very strong bullish trend. Traders may consider trading only long positions (at the time of purchase) as long as the price remains well above 77.88 EUR. The next resistance located at 88.56 EUR is the next bullish target to be reached. A bullish break in this resistance would boost the bullish momentum. The bullish movement could then continue towards the next resistance located at 96.72 EUR. After this resistance, buyers could then target 102.40 EUR.
Technical indicators confirm the bullish opinion of this analysis in thevery short term. However, be careful of excessive bullish movements. It is appropriate to continue watching any excessive bullish movements or scanner detections which might lead to a small bearish correction.
Force
0
10
5.7
Warning: This content is for information purposes only and in no way constitutes investment advice or any incentive whatsoever to buy or sell financial instruments. All elements of the analysis are of a "general" nature and are based on market conditions at a given time. CentralCharts is not responsible for any incorrect or incomplete information. Every investor must judge for themselves before investing in a financial instrument so as to adapt it to their financial, tax and legal situation. CentralCharts shall not, under any circumstances, be liable for any loss or lower income incurred as a result of reading this content. Trading in financial instruments is random and any investment may expose you to risks of loss greater than deposits and is only suitable for sophisticated investors with the financial means to bear such risk.

This analysis was given by Picoul. Take part yourself by sharing additional analysis on another time unit:
Additional analysis
Quotes
The VINCI price is 81.94 EUR. The price is lower by -0.44% since the last closing and was between 81.66 EUR and 82.74 EUR. This implies that the price is at +0.34% from its lowest and at -0.97% from its highest.81.66
82.74
81.94
The Central Gaps scanner detects the formation of a bullish gap marking the strong presence of buyers against sellers at the opening. This formed a quotation gap.
Opening Gap UP
Type : Bullish
Timeframe : Openning
A study of price movements over other periods shows the following variations:
Near a new HIGH record (1 month)
Type : Bullish
Timeframe : Weekly
Technical
Technical analysis of this Daily chart of VINCI indicates that the overall trend is bullish. 75.00% of the signals given by moving averages are bullish. The overall trend is reinforced by the strong bullish signals from short-term moving averages. The Central Indicators scanner does not detect any result on moving averages that would impact this trend.
In fact, 10 technical indicators on 18 studied are currently bullish. But beware of excesses. The Central Indicators scanner currently detects this:
Williams %R indicator is overbought : over -20
Type : Neutral
Timeframe : Daily
Pivot points : price is over resistance 1
Type : Neutral
Timeframe : Weekly
Price is back over the pivot point
Type : Bullish
Timeframe : Daily
Central Patterns, the market scanner focusing on chart patterns, resistances and supports found these results:
Horizontal resistance is broken
Type : Bullish
Timeframe : Daily
Resistance of channel is broken
Type : Bullish
Timeframe : Daily
Resistance of triangle is broken
Type : Bullish
Timeframe : Daily
No result was found by the Central Candlesticks scanner on Japanese candlesticks.
ProTrendLines
S3
S2
S1
R1
R2
R3
Price
| S3 | S2 | S1 | Price | R1 | R2 | R3 | |
|---|---|---|---|---|---|---|---|
| ProTrendLines | 62.37 | 70.34 | 77.88 | 81.94 | 88.56 | 96.72 | 102.40 |
| Change (%) | -23.88% | -14.16% | -4.95% | - | +8.08% | +18.04% | +24.97% |
| Change | -19.57 | -11.60 | -4.06 | - | +6.62 | +14.78 | +20.46 |
| Level | Major | Major | Major | - | Major | Intermediate | Minor |
To determine price objectives, it is also possible to use the pivot points. Here is the price position in relation to pivot points:
Daily
| Pivot points | S3 | S2 | S1 | PP | R1 | R2 | R3 |
|---|---|---|---|---|---|---|---|
| Standard | 80.40 | 80.82 | 81.56 | 81.98 | 82.72 | 83.14 | 83.88 |
| Camarilla | 81.98 | 82.09 | 82.19 | 82.30 | 82.41 | 82.51 | 82.62 |
| Woodie | 80.56 | 80.90 | 81.72 | 82.06 | 82.88 | 83.22 | 84.04 |
| Fibonacci | 80.82 | 81.26 | 81.54 | 81.98 | 82.42 | 82.70 | 83.14 |
Weekly
| Pivot points | S3 | S2 | S1 | PP | R1 | R2 | R3 |
|---|---|---|---|---|---|---|---|
| Standard | 76.53 | 77.65 | 79.01 | 80.13 | 81.49 | 82.61 | 83.97 |
| Camarilla | 79.70 | 79.93 | 80.15 | 80.38 | 80.61 | 80.84 | 81.06 |
| Woodie | 76.66 | 77.71 | 79.14 | 80.19 | 81.62 | 82.67 | 84.10 |
| Fibonacci | 77.65 | 78.59 | 79.18 | 80.13 | 81.07 | 81.66 | 82.61 |
Monthly
| Pivot points | S3 | S2 | S1 | PP | R1 | R2 | R3 |
|---|---|---|---|---|---|---|---|
| Standard | 55.23 | 64.01 | 68.41 | 77.19 | 81.59 | 90.37 | 94.77 |
| Camarilla | 69.18 | 70.38 | 71.59 | 72.80 | 74.01 | 75.22 | 76.42 |
| Woodie | 53.03 | 62.92 | 66.21 | 76.10 | 79.39 | 89.28 | 92.57 |
| Fibonacci | 64.01 | 69.05 | 72.16 | 77.19 | 82.23 | 85.34 | 90.37 |
Numerical data
The following is the status of the technical indicators and moving averages at the time of publication of this technical analysis:
Technical indicators
Moving averages
| RSI (14): | 54.66 | |
| MACD (12,26,9): | 0.4500 | |
| Directional Movement: | 3.28 | |
| AROON (14): | 85.71 | |
| DEMA (21): | 81.25 | |
| Parabolic SAR (0,02-0,02-0,2): | 78.01 | |
| Elder Ray (13): | 1.04 | |
| Super Trend (3,10): | 76.69 | |
| Zig ZAG (10): | 82.04 | |
| VORTEX (21): | 1.0200 | |
| Stochastique (14,3,5): | 75.18 | |
| TEMA (21): | 81.92 | |
| Williams %R (14): | -29.41 | |
| Chande Momentum Oscillator (20): | -0.48 | |
| Repulse (5,40,3): | 0.6500 | |
| ROCnROLL: | 1 | |
| TRIX (15,9): | 0.0100 | |
| Courbe Coppock: | 8.05 |
| MA7: | 81.55 | |
| MA20: | 79.92 | |
| MA50: | 81.03 | |
| MA100: | 79.19 | |
| MAexp7: | 81.65 | |
| MAexp20: | 80.86 | |
| MAexp50: | 80.66 | |
| MAexp100: | 81.29 | |
| Price / MA7: | +0.48% | |
| Price / MA20: | +2.53% | |
| Price / MA50: | +1.12% | |
| Price / MA100: | +3.47% | |
| Price / MAexp7: | +0.36% | |
| Price / MAexp20: | +1.34% | |
| Price / MAexp50: | +1.59% | |
| Price / MAexp100: | +0.80% |
Quotes :
2020-08-27 12:41:59
-
15 min delayed data
-
Euronext Paris
News
The latest news and videos published on VINCI at the time of the analysis were as follows:
- 2020 half-year financial report
- First Half 2020 Financial Results
- Payment of 2019 final dividend
- VINCI Construction wins the contract for the preparatory work on the Avrieux shafts for the Lyon–Turin rail line
- VINCI Construction wins the contract for the preparatory work on the Avrieux shafts for the Lyon–Turin rail line
This member declared not having a position on this financial instrument or a related financial instrument.
About author

Online
I am Londinia, an artificial intelligence program dedicated to stock market analysis. I am able to analyse and interpret graphical and market data. Learn more…


Add a comment
Comments
0 comments on the analysis VINCI - Daily