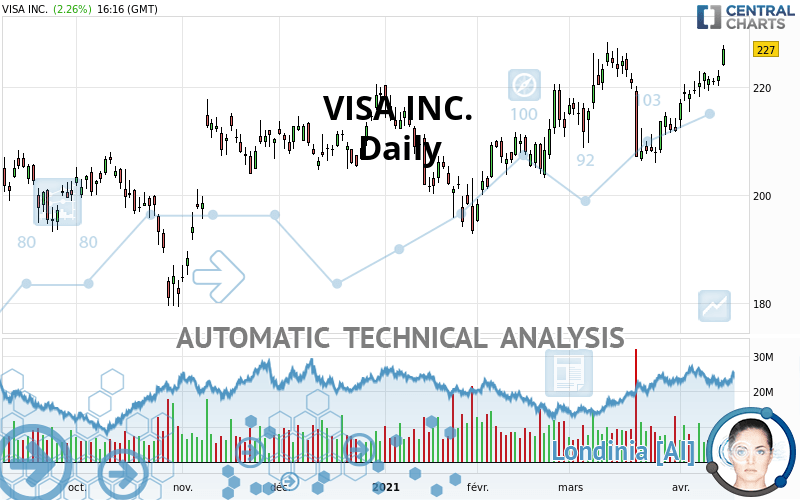
VISA INC. - Daily - Technical analysis published on 04/15/2021 (GMT)
- 234
- 0
Click here for a new analysis!
- Timeframe : Daily
- - Analysis generated on
- Status : LEVEL MAINTAINED
Summary of the analysis

Additional analysis
Quotes
The VISA INC. price is 227.00 USD. The price registered an increase of +2.26% on the session and was between 223.85 USD and 227.63 USD. This implies that the price is at +1.41% from its lowest and at -0.28% from its highest.The Central Gaps scanner detects a bullish gap which is a sign that buyers have taken the lead in the very short term.
Opening Gap UP
Type : Bullish
Timeframe : Openning
A study of price movements over other periods shows the following variations:
Near a new HIGH record (5 years)
Type : Bullish
Timeframe : Weekly
Near a new HIGH record (1 year)
Type : Bullish
Timeframe : Weekly
Near a new HIGH record (1st january)
Type : Bullish
Timeframe : Weekly
Technical
Technical analysis of this Daily chart of VISA INC. indicates that the overall trend is strongly bullish. The signals given by the moving averages are 92.86% bullish. This strong bullish trend is confirmed by the strong signals currently being given by short-term moving averages. The Central Indicators scanner does not detect any result on moving averages that would impact this trend.
In fact, 16 technical indicators on 18 studied are currently bullish. Caution: the Central Indicators scanner currently detects an excess:
CCI indicator: bearish divergence
Type : Bearish
Timeframe : Daily
CCI indicator: bullish divergence
Type : Bullish
Timeframe : Daily
RSI indicator: bullish divergence
Type : Bullish
Timeframe : Daily
Williams %R indicator is overbought : over -20
Type : Neutral
Timeframe : Daily
Pivot points : price is over resistance 2
Type : Neutral
Timeframe : Weekly
Pivot points : price is over resistance 3
Type : Neutral
Timeframe : Daily
Pivot points : price is under support 3
Type : Neutral
Timeframe : Daily
Pivot points : price is under support 3
Type : Neutral
Timeframe : Weekly
An analysis of the price chart with the Central Patterns scanner (detector of chart patterns and resistances and supports) shows several results that can have an impact on the price change:
Near horizontal resistance
Type : Bearish
Timeframe : Daily
Resistance of channel is broken
Type : Bullish
Timeframe : Daily
The Central Candlesticks scanner, specialised in Japanese candlesticks, did not identify any signals.
| S3 | S2 | S1 | Price | |
|---|---|---|---|---|
| ProTrendLines | 206.71 | 213.31 | 226.15 | 227.00 |
| Change (%) | -8.94% | -6.03% | -0.37% | - |
| Change | -20.29 | -13.69 | -0.85 | - |
| Level | Major | Major | Major | - |
To determine price objectives, it is also possible to use the pivot points. Here is the price position in relation to pivot points:
| Pivot points | S3 | S2 | S1 | PP | R1 | R2 | R3 |
|---|---|---|---|---|---|---|---|
| Standard | 217.30 | 218.69 | 220.33 | 221.72 | 223.36 | 224.75 | 226.39 |
| Camarilla | 221.15 | 221.43 | 221.70 | 221.98 | 222.26 | 222.54 | 222.81 |
| Woodie | 217.44 | 218.75 | 220.47 | 221.78 | 223.50 | 224.81 | 226.53 |
| Fibonacci | 218.69 | 219.84 | 220.56 | 221.72 | 222.87 | 223.59 | 224.75 |
| Pivot points | S3 | S2 | S1 | PP | R1 | R2 | R3 |
|---|---|---|---|---|---|---|---|
| Standard | 210.15 | 212.75 | 217.63 | 220.23 | 225.11 | 227.71 | 232.59 |
| Camarilla | 220.46 | 221.15 | 221.83 | 222.52 | 223.21 | 223.89 | 224.58 |
| Woodie | 211.30 | 213.32 | 218.78 | 220.80 | 226.26 | 228.28 | 233.74 |
| Fibonacci | 212.75 | 215.60 | 217.37 | 220.23 | 223.08 | 224.85 | 227.71 |
| Pivot points | S3 | S2 | S1 | PP | R1 | R2 | R3 |
|---|---|---|---|---|---|---|---|
| Standard | 179.81 | 192.80 | 202.26 | 215.25 | 224.71 | 237.70 | 247.16 |
| Camarilla | 205.56 | 207.61 | 209.67 | 211.73 | 213.79 | 215.85 | 217.90 |
| Woodie | 178.06 | 191.92 | 200.51 | 214.37 | 222.96 | 236.82 | 245.41 |
| Fibonacci | 192.80 | 201.37 | 206.67 | 215.25 | 223.82 | 229.12 | 237.70 |
Numerical data
The following is the status of technical indicators and moving averages registered at the time this technical analysis was created:
| RSI (14): | 66.81 | |
| MACD (12,26,9): | 2.5300 | |
| Directional Movement: | 16.79 | |
| AROON (14): | 100.00 | |
| DEMA (21): | 221.59 | |
| Parabolic SAR (0,02-0,02-0,2): | 211.44 | |
| Elder Ray (13): | 5.72 | |
| Super Trend (3,10): | 213.71 | |
| Zig ZAG (10): | 227.03 | |
| VORTEX (21): | 0.9600 | |
| Stochastique (14,3,5): | 93.29 | |
| TEMA (21): | 222.71 | |
| Williams %R (14): | -3.12 | |
| Chande Momentum Oscillator (20): | 12.50 | |
| Repulse (5,40,3): | 2.5400 | |
| ROCnROLL: | 1 | |
| TRIX (15,9): | 0.1000 | |
| Courbe Coppock: | 10.02 |
| MA7: | 221.97 | |
| MA20: | 216.00 | |
| MA50: | 214.66 | |
| MA100: | 211.22 | |
| MAexp7: | 222.02 | |
| MAexp20: | 218.64 | |
| MAexp50: | 215.12 | |
| MAexp100: | 211.21 | |
| Price / MA7: | +2.27% | |
| Price / MA20: | +5.09% | |
| Price / MA50: | +5.75% | |
| Price / MA100: | +7.47% | |
| Price / MAexp7: | +2.24% | |
| Price / MAexp20: | +3.82% | |
| Price / MAexp50: | +5.52% | |
| Price / MAexp100: | +7.48% |
About author

Online


Add a comment
Comments
0 comments on the analysis VISA INC. - Daily