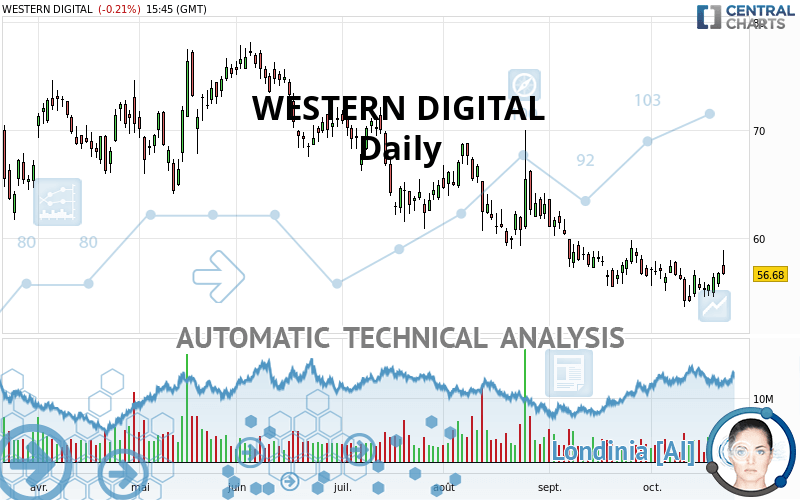
WESTERN DIGITAL - Daily - Technical analysis published on 10/22/2021 (GMT)
- 219
- 0
I am delighted to see that my first price objective has been achieved. I hope you've taken advantage of it.
Click here for a new analysis!
Click here for a new analysis!
- Timeframe : Daily
- - Analysis generated on
- Status : TARGET REACHED

Summary of the analysis
Trends
Short term:
Neutral
Underlying:
Bearish
Technical indicators
67%
0%
33%
My opinion
Bearish under 61.54 USD
My targets
55.32 USD (-2.40%)
49.47 USD (-12.72%)
My analysis
Has the basic bearish trend slowed or is it lacking in power? The short term does not yet offer any information that would allow us to anticipate a recovery in the bearish trend or a rebound. Sellers' generally have the upper hand, even if a small correction (not tradeable) on the resistance located at 61.54 USD remains possible. It is advisable to trade WESTERN DIGITAL with the greatest caution, while favouring short positions (for sale) as long as the price remains well below 61.54 USD. The next bearish objective for sellers is set at 55.32 USD. A bearish break of this support would revive the bearish momentum. The sellers could then target the support located at 49.47 USD. In case of crossing, the next objective would be the support located at 46.50 USD. PS: if there is a bullish break in the resistance located at 61.54 USD we suggest that you produce a new automated technical analysis. In fact, conditions should have changed. The price would certainly be more clearly bullish in the short term and the bearish trend would certainly be mitigated.
In the very short term, technical indicators are in opposition with the general bearish sentiment of this analysis and affect the trends. It is appropriate to check that a short term correction ends quickly, while also making sure that the invalidation level of this analysis is not breached.
Force
0
10
1.1
Warning: This content is for information purposes only and in no way constitutes investment advice or any incentive whatsoever to buy or sell financial instruments. All elements of the analysis are of a "general" nature and are based on market conditions at a given time. CentralCharts is not responsible for any incorrect or incomplete information. Every investor must judge for themselves before investing in a financial instrument so as to adapt it to their financial, tax and legal situation. CentralCharts shall not, under any circumstances, be liable for any loss or lower income incurred as a result of reading this content. Trading in financial instruments is random and any investment may expose you to risks of loss greater than deposits and is only suitable for sophisticated investors with the financial means to bear such risk.

This analysis was given by Vincent Launay. Take part yourself by sharing additional analysis on another time unit:
Additional analysis
Quotes
WESTERN DIGITAL rating 56.68 USD. On the day, this instrument lost -0.21% and was between 56.56 USD and 58.92 USD. This implies that the price is at +0.21% from its lowest and at -3.80% from its highest.56.56
58.92
56.68
The Central Gaps scanner detects the formation of a bullish gap marking the strong presence of buyers against sellers at the opening. This formed a quotation gap.
Opening Gap UP
Type : Bullish
Timeframe : Openning
Here is a more detailed summary of the historical variations registered by WESTERN DIGITAL:
Near a new HIGH record (1 month)
Type : Bullish
Timeframe : Weekly
Technical
Technical analysis of this Daily chart of WESTERN DIGITAL indicates that the overall trend is bearish. The signals given by moving averages are 75.00% bearish. This bearish trend could slow down given the neutral signals currently being given by short-term moving averages. The Central Indicators market scanner is currently detecting several bullish signals that could impact this trend:
Bullish trend reversal : adaptative moving average 20
Type : Bullish
Timeframe : Daily
Bullish price crossover with Moving Average 20
Type : Bullish
Timeframe : Daily
In fact, 12 technical indicators on 18 studied are currently positioned bullish. Other results related to technical indicators were also found by the Central Indicators scanner:
Price is back over the pivot point
Type : Bullish
Timeframe : Daily
Price is back under the pivot point
Type : Bearish
Timeframe : Weekly
The Central Patterns scanner, which studies chart patterns, resistances and supports, has identified these signals:
Near resistance of channel
Type : Bearish
Timeframe : Daily
Resistance of triangle is broken
Type : Bullish
Timeframe : Daily
The Central Candlesticks scanner which studies Japanese candlesticks did not detect anything.
ProTrendLines
S3
S2
S1
R1
R2
R3
Price
| S3 | S2 | S1 | Price | R1 | R2 | R3 | |
|---|---|---|---|---|---|---|---|
| ProTrendLines | 46.50 | 49.47 | 55.32 | 56.68 | 64.49 | 70.93 | 77.04 |
| Change (%) | -17.96% | -12.72% | -2.40% | - | +13.78% | +25.14% | +35.92% |
| Change | -10.18 | -7.21 | -1.36 | - | +7.81 | +14.25 | +20.36 |
| Level | Major | Intermediate | Major | - | Major | Major | Major |
Pivot points can also be used to set your price objectives. Here is the price situation in relation to pivot points:
Daily
| Pivot points | S3 | S2 | S1 | PP | R1 | R2 | R3 |
|---|---|---|---|---|---|---|---|
| Standard | 54.43 | 54.93 | 55.87 | 56.37 | 57.31 | 57.81 | 58.75 |
| Camarilla | 56.40 | 56.54 | 56.67 | 56.80 | 56.93 | 57.06 | 57.20 |
| Woodie | 54.64 | 55.04 | 56.08 | 56.48 | 57.52 | 57.92 | 58.96 |
| Fibonacci | 54.93 | 55.48 | 55.82 | 56.37 | 56.92 | 57.26 | 57.81 |
Weekly
| Pivot points | S3 | S2 | S1 | PP | R1 | R2 | R3 |
|---|---|---|---|---|---|---|---|
| Standard | 50.00 | 51.80 | 53.61 | 55.41 | 57.22 | 59.02 | 60.83 |
| Camarilla | 54.42 | 54.75 | 55.08 | 55.41 | 55.74 | 56.07 | 56.40 |
| Woodie | 50.00 | 51.80 | 53.61 | 55.41 | 57.22 | 59.02 | 60.83 |
| Fibonacci | 51.80 | 53.18 | 54.03 | 55.41 | 56.79 | 57.64 | 59.02 |
Monthly
| Pivot points | S3 | S2 | S1 | PP | R1 | R2 | R3 |
|---|---|---|---|---|---|---|---|
| Standard | 45.26 | 50.37 | 53.40 | 58.51 | 61.54 | 66.65 | 69.68 |
| Camarilla | 54.20 | 54.95 | 55.69 | 56.44 | 57.19 | 57.93 | 58.68 |
| Woodie | 44.23 | 49.85 | 52.37 | 57.99 | 60.51 | 66.13 | 68.65 |
| Fibonacci | 50.37 | 53.48 | 55.40 | 58.51 | 61.62 | 63.54 | 66.65 |
Numerical data
The following is the status of technical indicators and moving averages registered at the time this technical analysis was created:
Technical indicators
Moving averages
| RSI (14): | 51.32 | |
| MACD (12,26,9): | -0.6700 | |
| Directional Movement: | 5.25 | |
| AROON (14): | 57.14 | |
| DEMA (21): | 55.54 | |
| Parabolic SAR (0,02-0,02-0,2): | 53.61 | |
| Elder Ray (13): | 1.68 | |
| Super Trend (3,10): | 59.99 | |
| Zig ZAG (10): | 57.25 | |
| VORTEX (21): | 1.0000 | |
| Stochastique (14,3,5): | 67.99 | |
| TEMA (21): | 56.02 | |
| Williams %R (14): | -35.78 | |
| Chande Momentum Oscillator (20): | 0.52 | |
| Repulse (5,40,3): | 1.1400 | |
| ROCnROLL: | -1 | |
| TRIX (15,9): | -0.2500 | |
| Courbe Coppock: | 3.74 |
| MA7: | 56.16 | |
| MA20: | 56.51 | |
| MA50: | 58.61 | |
| MA100: | 63.74 | |
| MAexp7: | 56.28 | |
| MAexp20: | 56.65 | |
| MAexp50: | 58.83 | |
| MAexp100: | 61.36 | |
| Price / MA7: | +0.93% | |
| Price / MA20: | +0.30% | |
| Price / MA50: | -3.29% | |
| Price / MA100: | -11.08% | |
| Price / MAexp7: | +0.71% | |
| Price / MAexp20: | +0.05% | |
| Price / MAexp50: | -3.65% | |
| Price / MAexp100: | -7.63% |
Quotes :
-
15 min delayed data
-
NASDAQ Stocks
News
The latest news and videos published on WESTERN DIGITAL at the time of the analysis were as follows:
- Western Digital to Announce First Quarter Fiscal 2022 Financial Results on October 28, 2021
- The World Economic Forum Welcomes Western Digital to Prestigious Global Lighthouse Network
- Western Digital’s Ambitious Carbon Reduction Goals Approved by the Science Based Targets initiative
- Western Digital to Participate in Upcoming Investor Conferences
- Western Digital Reimagines the Hard Drive
This member declared not having a position on this financial instrument or a related financial instrument.
About author

Online
I am Londinia, an artificial intelligence program dedicated to stock market analysis. I am able to analyse and interpret graphical and market data. Learn more…


Add a comment
Comments
0 comments on the analysis WESTERN DIGITAL - Daily