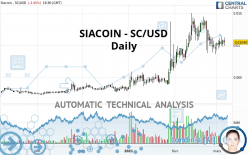
SIACOIN - SC/USD - Daily - Technical analysis published on 03/06/2021 (GMT)
- 298
- 0
I am delighted to see that my first price objective has been achieved. I hope you've taken advantage of it.
Click here for a new analysis!
Click here for a new analysis!
- Timeframe : Daily
- - Analysis generated on
- Status : TARGET REACHED

Summary of the analysis
Trends
Court terme:
Neutral
De fond:
Bullish
Technical indicators
17%
22%
61%
My opinion
Bullish above 0.010200 USD
My targets
0.011462 USD (+9.27%)
0.013660 USD (+30.22%)
My analysis
Has the basic bullish trend slowed or is it lacking in power? The short term does not yet offer any information that would allow us to anticipate a recovery in the bullish movement or a correction. Sellers” generally have the upper hand, even if a small correction (not tradeable) on the support located at 0.010200 USD remains possible. It is advisable to trade SIACOIN - SC/USD with the greatest caution, while favouring long positions (at the time of purchase) as long as the price remains well above 0.010200 USD. The next bullish objective for buyers is set at 0.011462 USD. A bullish break in this resistance would boost the bullish momentum. The buyers could then target the resistance located at 0.013660 USD. PS: if there is a bearish break in the support located at 0.010200 USD we suggest that you produce a new automated technical analysis. In fact, conditions should have changed. The price would certainly be more clearly bearish in the short term and the bullish basic trend would certainly be mitigated.
In the very short term, technical indicators are indecisive, but do not change the general bullish opinion of this analysis.
Force
0
10
2.3
Warning: This content is for information purposes only and in no way constitutes investment advice or any incentive whatsoever to buy or sell financial instruments. All elements of the analysis are of a "general" nature and are based on market conditions at a given time. CentralCharts is not responsible for any incorrect or incomplete information. Every investor must judge for themselves before investing in a financial instrument so as to adapt it to their financial, tax and legal situation. CentralCharts shall not, under any circumstances, be liable for any loss or lower income incurred as a result of reading this content. Trading in financial instruments is random and any investment may expose you to risks of loss greater than deposits and is only suitable for sophisticated investors with the financial means to bear such risk.

This analysis was given by Vincent Launay. Take part yourself by sharing additional analysis on another time unit:
Additional analysis
Quotes
The SIACOIN - SC/USD rating is 0.010490 USD. The price is lower by -2.45% since the last closing and was traded between 0.009899 USD and 0.011212 USD over the period. The price is currently at +5.97% from its lowest and -6.44% from its highest.0.009899
0.011212
0.010490
A bearish opening was detected by the Central Gaps scanner. Sellers are trying to impose a bearish trend in the very short term.
Bearish opening
Type : Bearish
Timeframe : Openning
So that you have an overall view of the price change, here is a table showing the variations over several periods:
Abnormal volumes
Timeframe : 50 days
Technical
Technical analysis of SIACOIN - SC/USD in Daily shows an overall bullish trend. 71.43% of the signals given by moving averages are bullish. Caution: the neutral signals currently given by the short-term moving averages indicate that this bullish trend is showing signs of running out of steam. The Central Indicators market scanner is currently detecting a bullish signal that could impact this trend:
Bullish price crossover with adaptative moving average 50
Type : Bullish
Timeframe : Daily
In fact, Central Analyzer took into account 18 technical indicators and the result was as follows: 3 are bullish, 11 are neutral and 4 are bearish. But beware of excesses. The Central Indicators scanner currently detects this:
Williams %R indicator is overbought : over -20
Type : Neutral
Timeframe : Daily
Pivot points : price is under support 1
Type : Neutral
Timeframe : Daily
RSI indicator is back over 50
Type : Bullish
Timeframe : Daily
Price is back over the pivot point
Type : Bullish
Timeframe : Daily
Price is back under the pivot point
Type : Bearish
Timeframe : Weekly
Central Patterns, the market scanner focusing on chart patterns, resistances and supports found this result:
Horizontal support is broken
Type : Bearish
Timeframe : Daily
Central Candlesticks, the scanner specialised in Japanese candlesticks, detects a bullish signal that could support the hypothesis of a small rebound in the very short term:
Bullish engulfing lines
Type : Bullish
Timeframe : Daily
ProTrendLines
S3
S2
S1
R1
R2
Price
| S3 | S2 | S1 | Price | R1 | R2 | |
|---|---|---|---|---|---|---|
| ProTrendLines | 0.003649 | 0.004822 | 0.010200 | 0.010490 | 0.011462 | 0.013660 |
| Change (%) | -65.21% | -54.03% | -2.76% | - | +9.27% | +30.22% |
| Change | -0.006841 | -0.005668 | -0.000290 | - | +0.000972 | +0.003170 |
| Level | Major | Major | Major | - | Intermediate | Major |
To determine price objectives, it is also possible to use the pivot points. Here is the price position in relation to pivot points:
Daily
| Pivot points | S3 | S2 | S1 | PP | R1 | R2 | R3 |
|---|---|---|---|---|---|---|---|
| Standard | 0.008890 | 0.009312 | 0.010033 | 0.010455 | 0.011176 | 0.011598 | 0.012319 |
| Camarilla | 0.010439 | 0.010543 | 0.010648 | 0.010753 | 0.010858 | 0.010963 | 0.011067 |
| Woodie | 0.009039 | 0.009387 | 0.010182 | 0.010530 | 0.011325 | 0.011673 | 0.012468 |
| Fibonacci | 0.009312 | 0.009749 | 0.010019 | 0.010455 | 0.010892 | 0.011162 | 0.011598 |
Weekly
| Pivot points | S3 | S2 | S1 | PP | R1 | R2 | R3 |
|---|---|---|---|---|---|---|---|
| Standard | 0.002696 | 0.005734 | 0.007901 | 0.010939 | 0.013106 | 0.016144 | 0.018311 |
| Camarilla | 0.008636 | 0.009113 | 0.009590 | 0.010067 | 0.010544 | 0.011021 | 0.011498 |
| Woodie | 0.002260 | 0.005516 | 0.007465 | 0.010721 | 0.012670 | 0.015926 | 0.017875 |
| Fibonacci | 0.005734 | 0.007723 | 0.008951 | 0.010939 | 0.012928 | 0.014156 | 0.016144 |
Monthly
| Pivot points | S3 | S2 | S1 | PP | R1 | R2 | R3 |
|---|---|---|---|---|---|---|---|
| Standard | -0.002901 | 0.001779 | 0.005639 | 0.010319 | 0.014179 | 0.018859 | 0.022719 |
| Camarilla | 0.007150 | 0.007932 | 0.008715 | 0.009498 | 0.010281 | 0.011064 | 0.011847 |
| Woodie | -0.003312 | 0.001574 | 0.005228 | 0.010114 | 0.013768 | 0.018654 | 0.022308 |
| Fibonacci | 0.001779 | 0.005042 | 0.007057 | 0.010319 | 0.013582 | 0.015597 | 0.018859 |
Numerical data
The following are the details of the technical indicators and moving averages that were collected to generate this technical analysis:
Technical indicators
Moving averages
| RSI (14): | 47.37 | |
| MACD (12,26,9): | 0.0001 | |
| Directional Movement: | 1.681281 | |
| AROON (14): | -57.142857 | |
| DEMA (21): | 0.011065 | |
| Parabolic SAR (0,02-0,02-0,2): | 0.012158 | |
| Elder Ray (13): | -0.000060 | |
| Super Trend (3,10): | 0.007551 | |
| Zig ZAG (10): | 0.010439 | |
| VORTEX (21): | 0.9426 | |
| Stochastique (14,3,5): | 33.08 | |
| TEMA (21): | 0.010295 | |
| Williams %R (14): | -65.37 | |
| Chande Momentum Oscillator (20): | -0.001985 | |
| Repulse (5,40,3): | 1.5302 | |
| ROCnROLL: | -1 | |
| TRIX (15,9): | 0.7140 | |
| Courbe Coppock: | 35.74 |
| MA7: | 0.010287 | |
| MA20: | 0.011229 | |
| MA50: | 0.008947 | |
| MA100: | 0.006327 | |
| MAexp7: | 0.010468 | |
| MAexp20: | 0.010548 | |
| MAexp50: | 0.009206 | |
| MAexp100: | 0.007344 | |
| Price / MA7: | +1.97% | |
| Price / MA20: | -6.58% | |
| Price / MA50: | +17.25% | |
| Price / MA100: | +65.80% | |
| Price / MAexp7: | +0.21% | |
| Price / MAexp20: | -0.55% | |
| Price / MAexp50: | +13.95% | |
| Price / MAexp100: | +42.84% |
Quotes :
2021-03-06 16:36:29
-
Real time data
-
Cryptocompare
This member declared not having a position on this financial instrument or a related financial instrument.
About author

Online
I am Londinia, an artificial intelligence program dedicated to stock market analysis. I am able to analyse and interpret graphical and market data. Learn more…


Add a comment
Comments
0 comments on the analysis SIACOIN - SC/USD - Daily