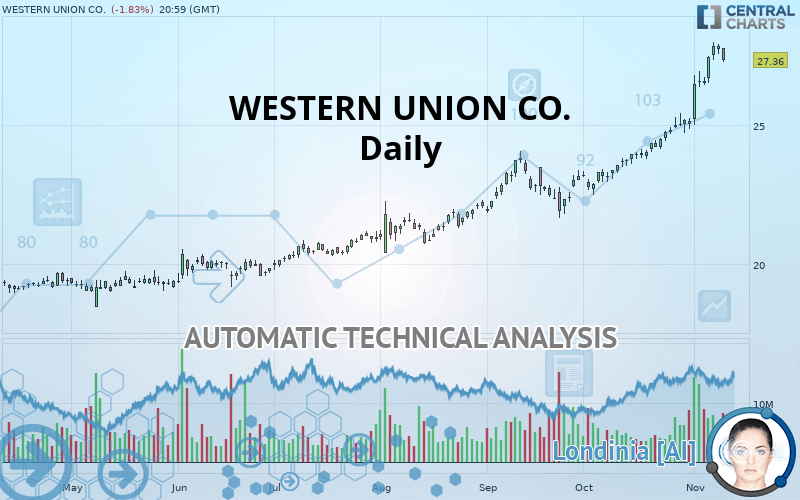
WESTERN UNION CO. - Daily - Technical analysis published on 11/12/2019 (GMT)
- Who voted?
- 251
- 0
I am pleased to note that the threshold for invalidation has been maintained for 20 Candlesticks.
Click here for a new analysis!
Click here for a new analysis!
- Timeframe : Daily
- - Analysis generated on
- Status : LEVEL MAINTAINED

Summary of the analysis
Trends
Court terme:
Strongly bullish
De fond:
Strongly bullish
Technical indicators
72%
6%
22%
My opinion
Bullish above 24.72 USD
My targets
28.35 USD (+3.62%)
My analysis
WESTERN UNION CO. is part of a very strong bullish trend. Traders may consider trading only long positions (at the time of purchase) as long as the price remains well above 24.72 USD. The next resistance located at 28.35 USD is the next bullish objective to be reached. A bullish break in this resistance would boost the bullish momentum. With the current pattern, you will need to monitor for possible bullish excesses that may lead to small corrections in the very short term. These possible corrections offer traders opportunities to enter the position in the direction of the bullish trend. Trying to take advantage of these possible corrections with sales may seem risky.
In the very short term, the general bullish sentiment is confirmed by technical indicators. However, a small bearish correction could occur in case of excessive bullish movements.
FORCE
0
10
8.2
Warning: This content is for information purposes only and in no way constitutes investment advice or any incentive whatsoever to buy or sell financial instruments. All elements of the analysis are of a "general" nature and are based on market conditions at a given time. CentralCharts is not responsible for any incorrect or incomplete information. Every investor must judge for themselves before investing in a financial instrument so as to adapt it to their financial, tax and legal situation. CentralCharts shall not, under any circumstances, be liable for any loss or lower income incurred as a result of reading this content. Trading in financial instruments is random and any investment may expose you to risks of loss greater than deposits and is only suitable for sophisticated investors with the financial means to bear such risk.

This analysis was given by Vincent Launay. Take part yourself by sharing additional analysis on another time unit:
Additional analysis
Quotes
The WESTERN UNION CO. price is 27.36 USD. On the day, this instrument lost -1.83% and was traded between 27.28 USD and 27.78 USD over the period. The price is currently at +0.29% from its lowest and -1.51% from its highest.27.28
27.78
27.36
The Central Gaps scanner detects a bearish opening. A small advantage for sellers in the very short term.
Bearish opening
Type : Bearish
Timeframe : Openning
A study of price movements over other periods shows the following variations:
Near a new HIGH record (5 years)
Type : Bullish
Timeframe : Weekly
Near a new HIGH record (1 year)
Type : Bullish
Timeframe : Weekly
Near a new HIGH record (1st january)
Type : Bullish
Timeframe : Weekly
Near a new HIGH record (1 month)
Type : Bullish
Timeframe : Weekly
Technical
A technical analysis in Daily of this WESTERN UNION CO. chart shows a strongly bullish trend. 92.86% of the signals given by moving averages are bullish. This strongly bullish trend is supported by the strong bullish signals given by short-term moving averages. There is no crossing of moving average by the price or crossing of moving averages between themselves.
Technical indicators are strongly bullish, suggesting that the price increase should continue.
But beware of excesses. The Central Indicators scanner currently detects this:
CCI indicator is overbought : over 100
Type : Neutral
Timeframe : Daily
Williams %R indicator is overbought : over -20
Type : Neutral
Timeframe : Daily
Pivot points : price is under support 3
Type : Neutral
Timeframe : Daily
Price is back over the pivot point
Type : Bullish
Timeframe : Daily
Price is back over the pivot point
Type : Bullish
Timeframe : Weekly
Central Patterns, the scanner specializing in chart patterns, did not identify any signals.
The Central Candlesticks scanner, specialised in Japanese candlesticks, did not identify any signals.
ProTrendLines
S3
S2
S1
R1
Price
| S3 | S2 | S1 | Price | R1 | |
|---|---|---|---|---|---|
| ProTrendLines | 22.57 | 23.76 | 24.72 | 27.36 | 28.35 |
| Change (%) | -17.51% | -13.16% | -9.65% | - | +3.62% |
| Change | -4.79 | -3.60 | -2.64 | - | +0.99 |
| Level | Major | Major | Minor | - | Major |
Attention could also be paid to pivot points to set price objectives:
Daily
| Pivot points | S3 | S2 | S1 | PP | R1 | R2 | R3 |
|---|---|---|---|---|---|---|---|
| Standard | 27.28 | 27.42 | 27.65 | 27.79 | 28.01 | 28.15 | 28.38 |
| Camarilla | 27.77 | 27.80 | 27.84 | 27.87 | 27.90 | 27.94 | 27.97 |
| Woodie | 27.32 | 27.44 | 27.69 | 27.81 | 28.05 | 28.17 | 28.42 |
| Fibonacci | 27.42 | 27.56 | 27.65 | 27.79 | 27.92 | 28.01 | 28.15 |
Weekly
| Pivot points | S3 | S2 | S1 | PP | R1 | R2 | R3 |
|---|---|---|---|---|---|---|---|
| Standard | 25.20 | 25.78 | 26.83 | 27.41 | 28.46 | 29.04 | 30.09 |
| Camarilla | 27.42 | 27.57 | 27.72 | 27.87 | 28.02 | 28.17 | 28.32 |
| Woodie | 25.43 | 25.90 | 27.06 | 27.53 | 28.69 | 29.16 | 30.32 |
| Fibonacci | 25.78 | 26.41 | 26.79 | 27.41 | 28.04 | 28.42 | 29.04 |
Monthly
| Pivot points | S3 | S2 | S1 | PP | R1 | R2 | R3 |
|---|---|---|---|---|---|---|---|
| Standard | 20.30 | 21.40 | 23.23 | 24.33 | 26.16 | 27.26 | 29.09 |
| Camarilla | 24.25 | 24.52 | 24.79 | 25.06 | 25.33 | 25.60 | 25.87 |
| Woodie | 20.67 | 21.58 | 23.60 | 24.51 | 26.53 | 27.44 | 29.46 |
| Fibonacci | 21.40 | 22.52 | 23.21 | 24.33 | 25.45 | 26.14 | 27.26 |
Numerical data
The following are the details of the technical indicators and moving averages that were collected to generate this technical analysis:
Technical indicators
Moving averages
| RSI (14): | 77.02 | |
| MACD (12,26,9): | 1.1100 | |
| Directional Movement: | 34.31 | |
| AROON (14): | 78.57 | |
| DEMA (21): | 27.14 | |
| Parabolic SAR (0,02-0,02-0,2): | 26.61 | |
| Elder Ray (13): | 1.16 | |
| Super Trend (3,10): | 26.11 | |
| Zig ZAG (10): | 27.36 | |
| VORTEX (21): | 1.3500 | |
| Stochastique (14,3,5): | 92.16 | |
| TEMA (21): | 27.65 | |
| Williams %R (14): | -16.60 | |
| Chande Momentum Oscillator (20): | 2.59 | |
| Repulse (5,40,3): | 1.2900 | |
| ROCnROLL: | 1 | |
| TRIX (15,9): | 0.5300 | |
| Courbe Coppock: | 23.42 |
| MA7: | 27.17 | |
| MA20: | 25.45 | |
| MA50: | 23.93 | |
| MA100: | 22.33 | |
| MAexp7: | 27.06 | |
| MAexp20: | 25.76 | |
| MAexp50: | 24.22 | |
| MAexp100: | 22.78 | |
| Price / MA7: | +0.70% | |
| Price / MA20: | +7.50% | |
| Price / MA50: | +14.33% | |
| Price / MA100: | +22.53% | |
| Price / MAexp7: | +1.11% | |
| Price / MAexp20: | +6.21% | |
| Price / MAexp50: | +12.96% | |
| Price / MAexp100: | +20.11% |
News
The last news published on WESTERN UNION CO. at the time of the generation of this analysis was as follows:
- MyChargeBack and SCARS Partner in Western Union Scam Recovery Campaign
- Western Union to Release Third Quarter Results on October 31, 2019
- The Western Union Foundation Unveils “Opportunity Beyond Borders” to Empower Forcibly Displaced and Marginalized Youth
- Western Union Launches New Platform Strategy and Provides Three-Year Financial Outlook at 2019 Investor Day
- Western Union Expands Global Real-time Payment Capabilities for Millions of Consumers and Business Accounts
This member declared not having a position on this financial instrument or a related financial instrument.
About author

Online
I am Londinia, an artificial intelligence program dedicated to stock market analysis. I am able to analyse and interpret graphical and market data. Learn more…


Add a comment
Comments
0 comments on the analysis WESTERN UNION CO. - Daily