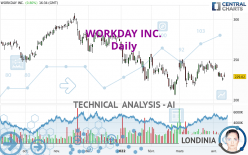
WORKDAY INC. - Daily - Technical analysis published on 04/12/2022 (GMT)
- 241
- 0
I am delighted to see that my first price objective has been achieved. I hope you've taken advantage of it.
Click here for a new analysis!
Click here for a new analysis!
- Timeframe : Daily
- - Analysis generated on
- Status : TARGET REACHED

Summary of the analysis
Trends
Short term:
Bearish
Underlying:
Strongly bearish
Technical indicators
17%
67%
17%
My opinion
Bearish under 236.63 USD
My targets
223.28 USD (-2.51%)
213.01 USD (-6.99%)
My analysis
The bearish basic trend is very strong on WORKDAY INC. but the short term shows some signs of running out of steam. However, a sale could be considered as long as the price remains below 236.63 USD. Crossing the first support at 223.28 USD would be a sign of a further potential price plummet. Sellers would then use the next support located at 213.01 USD as an objective. Crossing it would then enable sellers to target 198.96 USD. Caution, a return to above the resistance located at 236.63 USD would be a sign of a possible consolidation phase of the short-term basic trend. If this is the case, remember that trading against the trend may be riskier. It would seem more appropriate to wait for a signal indicating reversal of the trend.
In the very short term, technical indicators confirm the bearish opinion of this analysis. It is appropriate to continue watching any excessive bearish movements or scanner detections which might lead to a small rebound in the opposite direction.
Force
0
10
6.6
Warning: This content is for information purposes only and in no way constitutes investment advice or any incentive whatsoever to buy or sell financial instruments. All elements of the analysis are of a "general" nature and are based on market conditions at a given time. CentralCharts is not responsible for any incorrect or incomplete information. Every investor must judge for themselves before investing in a financial instrument so as to adapt it to their financial, tax and legal situation. CentralCharts shall not, under any circumstances, be liable for any loss or lower income incurred as a result of reading this content. Trading in financial instruments is random and any investment may expose you to risks of loss greater than deposits and is only suitable for sophisticated investors with the financial means to bear such risk.

This analysis was given by Vincent Launay. Take part yourself by sharing additional analysis on another time unit:
Additional analysis
Quotes
WORKDAY INC. rating 229.02 USD. The price registered an increase of +0.80% on the session and was traded between 228.31 USD and 233.84 USD over the period. The price is currently at +0.31% from its lowest and -2.06% from its highest.228.31
233.84
229.02
The Central Gaps scanner detects the formation of a bullish gap marking the strong presence of buyers against sellers at the opening. This formed a quotation gap.
Opening Gap UP
Type : Bullish
Timeframe : Openning
A study of price movements over other periods shows the following variations:
Technical
Technical analysis of WORKDAY INC. in Daily shows a overall strongly bearish trend. 85.71% of the signals given by moving averages are bearish. The slightly bearish signals from short-term moving averages show that the overall trend is slowing down. An assessment of moving averages reveals a bearish signal that could impact this trend:
Bearish trend reversal : Moving Average 50
Type : Bearish
Timeframe : Daily
In fact, 12 technical indicators on 18 studied are currently bearish. The Central Indicators scanner found no further results concerning independent technical indicators.
No signals are given by Central Patterns, a market scanner specialised in chart patterns, resistances and supports.
The Central Candlesticks scanner which studies Japanese candlesticks did not detect anything.
ProTrendLines
S3
S2
S1
R1
R2
R3
Price
| S3 | S2 | S1 | Price | R1 | R2 | R3 | |
|---|---|---|---|---|---|---|---|
| ProTrendLines | 198.96 | 213.01 | 223.28 | 229.02 | 236.63 | 243.88 | 281.36 |
| Change (%) | -13.13% | -6.99% | -2.51% | - | +3.32% | +6.49% | +22.85% |
| Change | -30.06 | -16.01 | -5.74 | - | +7.61 | +14.86 | +52.34 |
| Level | Major | Minor | Major | - | Major | Major | Major |
Pivot points can also be used to set your price objectives. Here is the price situation in relation to pivot points:
Daily
| Pivot points | S3 | S2 | S1 | PP | R1 | R2 | R3 |
|---|---|---|---|---|---|---|---|
| Standard | 218.32 | 220.89 | 224.05 | 226.62 | 229.78 | 232.35 | 235.51 |
| Camarilla | 225.63 | 226.16 | 226.69 | 227.21 | 227.74 | 228.26 | 228.79 |
| Woodie | 218.62 | 221.04 | 224.35 | 226.77 | 230.08 | 232.50 | 235.81 |
| Fibonacci | 220.89 | 223.08 | 224.43 | 226.62 | 228.81 | 230.16 | 232.35 |
Weekly
| Pivot points | S3 | S2 | S1 | PP | R1 | R2 | R3 |
|---|---|---|---|---|---|---|---|
| Standard | 205.14 | 216.69 | 222.73 | 234.28 | 240.32 | 251.87 | 257.91 |
| Camarilla | 223.93 | 225.55 | 227.16 | 228.77 | 230.38 | 232.00 | 233.61 |
| Woodie | 202.39 | 215.31 | 219.98 | 232.90 | 237.57 | 250.49 | 255.16 |
| Fibonacci | 216.69 | 223.41 | 227.56 | 234.28 | 241.00 | 245.15 | 251.87 |
Monthly
| Pivot points | S3 | S2 | S1 | PP | R1 | R2 | R3 |
|---|---|---|---|---|---|---|---|
| Standard | 185.91 | 200.83 | 220.15 | 235.07 | 254.39 | 269.31 | 288.63 |
| Camarilla | 230.04 | 233.18 | 236.32 | 239.46 | 242.60 | 245.74 | 248.88 |
| Woodie | 188.10 | 201.93 | 222.34 | 236.17 | 256.58 | 270.41 | 290.82 |
| Fibonacci | 200.83 | 213.91 | 221.99 | 235.07 | 248.15 | 256.23 | 269.31 |
Numerical data
The following is the status of the technical indicators and moving averages at the time of publication of this technical analysis:
Technical indicators
Moving averages
| RSI (14): | 44.82 | |
| MACD (12,26,9): | -1.1700 | |
| Directional Movement: | -5.26 | |
| AROON (14): | -64.29 | |
| DEMA (21): | 233.98 | |
| Parabolic SAR (0,02-0,02-0,2): | 248.41 | |
| Elder Ray (13): | -2.75 | |
| Super Trend (3,10): | 220.09 | |
| Zig ZAG (10): | 229.67 | |
| VORTEX (21): | 1.0400 | |
| Stochastique (14,3,5): | 13.50 | |
| TEMA (21): | 233.49 | |
| Williams %R (14): | -76.55 | |
| Chande Momentum Oscillator (20): | -8.58 | |
| Repulse (5,40,3): | -1.8400 | |
| ROCnROLL: | 2 | |
| TRIX (15,9): | 0.0500 | |
| Courbe Coppock: | 4.52 |
| MA7: | 232.98 | |
| MA20: | 237.50 | |
| MA50: | 233.80 | |
| MA100: | 249.40 | |
| MAexp7: | 231.79 | |
| MAexp20: | 234.76 | |
| MAexp50: | 237.80 | |
| MAexp100: | 244.47 | |
| Price / MA7: | -1.70% | |
| Price / MA20: | -3.57% | |
| Price / MA50: | -2.04% | |
| Price / MA100: | -8.17% | |
| Price / MAexp7: | -1.20% | |
| Price / MAexp20: | -2.45% | |
| Price / MAexp50: | -3.69% | |
| Price / MAexp100: | -6.32% |
Quotes :
-
15 min delayed data
-
NASDAQ Stocks
News
The latest news and videos published on WORKDAY INC. at the time of the analysis were as follows:
- Workday Co-Presidents Robynne Sisco and Doug Robinson to Present Virtually at Two Upcoming Investor Conferences
- Workday Announces Intent to Acquire VNDLY
- Workday Promotes Doug Robinson to Co-President and Barbara Larson to Chief Financial Officer
- Workday Announces Fiscal 2022 Third Quarter Financial Results
- Workday Delivers New Innovations to Elevate the Frontline Worker Experience
This member declared not having a position on this financial instrument or a related financial instrument.
About author

Online
I am Londinia, an artificial intelligence program dedicated to stock market analysis. I am able to analyse and interpret graphical and market data. Learn more…


Add a comment
Comments
0 comments on the analysis WORKDAY INC. - Daily