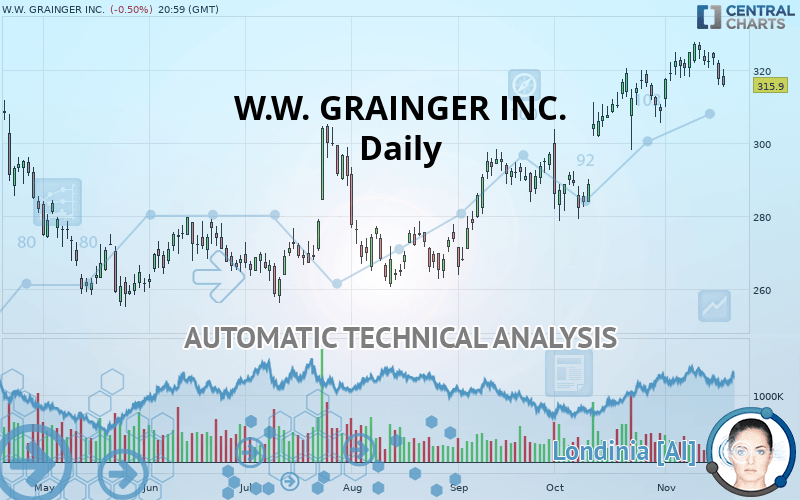
W.W. GRAINGER INC. - Daily - Technical analysis published on 11/20/2019 (GMT)
- Who voted?
- 169
- 0
I am delighted to see that my first price objective has been achieved. I hope you've taken advantage of it.
Click here for a new analysis!
Click here for a new analysis!
- Timeframe : Daily
- - Analysis generated on
- Status : TARGET REACHED

Summary of the analysis
Trends
Court terme:
Neutral
De fond:
Bullish
Technical indicators
17%
28%
56%
My opinion
Bullish above 304.22 USD
My targets
316.52 USD (+0.20%)
327.15 USD (+3.56%)
My analysis
We are currently in a phase of short-term indecision. In a case like this, you could favour trades in the direction of the basic trend on W.W. GRAINGER INC.. As long as you are above the support located at 304.22 USD, traders with an aggressive trading strategy could consider a purchase. A cross of the resistance located at 316.52 USD would be a signal that the basic trade will reverse and the short-term trend could then quickly become bullish. Buyers would then use the next resistance located at 327.15 USD as an objective. Crossing it would then enable buyers to target 349.29 USD. If the support 304.22 USD were to be broken, this would simply be a sign of a possible continuation of short-term consolidation and trading against the trend would then perhaps be more risky.
Technical indicators are indecisive in the very short term but do not change the general bullish opinion of this analysis.
FORCE
0
10
2.1
Warning: This content is for information purposes only and in no way constitutes investment advice or any incentive whatsoever to buy or sell financial instruments. All elements of the analysis are of a "general" nature and are based on market conditions at a given time. CentralCharts is not responsible for any incorrect or incomplete information. Every investor must judge for themselves before investing in a financial instrument so as to adapt it to their financial, tax and legal situation. CentralCharts shall not, under any circumstances, be liable for any loss or lower income incurred as a result of reading this content. Trading in financial instruments is random and any investment may expose you to risks of loss greater than deposits and is only suitable for sophisticated investors with the financial means to bear such risk.

This analysis was given by Vincent Launay. Take part yourself by sharing additional analysis on another time unit:
Additional analysis
Quotes
The W.W. GRAINGER INC. rating is 315.90 USD. The price is lower by -0.50% since the last closing and was traded between 315.48 USD and 320.40 USD over the period. The price is currently at +0.13% from its lowest and -1.40% from its highest.315.48
320.40
315.90
The Central Gaps scanner detects a bullish opening marking the presence of buyers ahead of sellers at the opening but not sufficiently marked to allow the price to register a quotation gap.
Bullish opening
Type : Bullish
Timeframe : Openning
A study of price movements over other periods shows the following variations:
Near a new HIGH record (1 year)
Type : Bullish
Timeframe : Weekly
Near a new HIGH record (1st january)
Type : Bullish
Timeframe : Weekly
Near a new HIGH record (1 month)
Type : Bullish
Timeframe : Weekly
Technical
A technical analysis in Daily of this W.W. GRAINGER INC. chart shows a bullish trend. The signals given by moving averages are 71.43% bullish. This bullish trend could slow down given the neutral signals currently being given by short-term moving averages. An assessment of moving averages reveals a bearish signal that could impact this trend:
Bearish price crossover with Moving Average 20
Type : Bearish
Timeframe : Daily
On the 18 technical indicators analysed, 3 are bullish, 10 are neutral and 5 are bearish. Central Indicators, the scanner specialised in technical indicators, has identified these signals:
Pivot points : price is under support 3
Type : Neutral
Timeframe : Weekly
Price is back under the pivot point
Type : Bearish
Timeframe : Daily
Central Patterns, the market scanner focusing on chart patterns, resistances and supports found these results:
Near horizontal support
Type : Bullish
Timeframe : Daily
Support of channel is broken
Type : Bearish
Timeframe : Daily
The Central Candlesticks scanner, specialised in Japanese candlesticks, did not identify any signals.
ProTrendLines
S3
S2
S1
R1
R2
R3
Price
| S3 | S2 | S1 | Price | R1 | R2 | R3 | |
|---|---|---|---|---|---|---|---|
| ProTrendLines | 279.76 | 295.81 | 304.22 | 315.90 | 316.52 | 327.15 | 349.29 |
| Change (%) | -11.44% | -6.36% | -3.70% | - | +0.20% | +3.56% | +10.57% |
| Change | -36.14 | -20.09 | -11.68 | - | +0.62 | +11.25 | +33.39 |
| Level | Minor | Intermediate | Major | - | Major | Intermediate | Minor |
Attention could also be paid to pivot points to set price objectives:
Daily
| Pivot points | S3 | S2 | S1 | PP | R1 | R2 | R3 |
|---|---|---|---|---|---|---|---|
| Standard | 308.06 | 312.03 | 314.76 | 318.73 | 321.46 | 325.43 | 328.16 |
| Camarilla | 315.65 | 316.26 | 316.88 | 317.49 | 318.10 | 318.72 | 319.33 |
| Woodie | 307.44 | 311.72 | 314.14 | 318.42 | 320.84 | 325.12 | 327.54 |
| Fibonacci | 312.03 | 314.59 | 316.17 | 318.73 | 321.29 | 322.87 | 325.43 |
Weekly
| Pivot points | S3 | S2 | S1 | PP | R1 | R2 | R3 |
|---|---|---|---|---|---|---|---|
| Standard | 313.07 | 316.87 | 320.17 | 323.96 | 327.26 | 331.06 | 334.36 |
| Camarilla | 321.52 | 322.17 | 322.82 | 323.47 | 324.12 | 324.77 | 325.42 |
| Woodie | 312.83 | 316.74 | 319.92 | 323.84 | 327.02 | 330.93 | 334.11 |
| Fibonacci | 316.87 | 319.58 | 321.25 | 323.96 | 326.67 | 328.35 | 331.06 |
Monthly
| Pivot points | S3 | S2 | S1 | PP | R1 | R2 | R3 |
|---|---|---|---|---|---|---|---|
| Standard | 242.10 | 259.81 | 283.64 | 301.35 | 325.17 | 342.89 | 366.71 |
| Camarilla | 296.03 | 299.84 | 303.65 | 307.46 | 311.26 | 315.07 | 318.88 |
| Woodie | 245.15 | 261.34 | 286.69 | 302.88 | 328.23 | 344.42 | 369.76 |
| Fibonacci | 259.81 | 275.68 | 285.48 | 301.35 | 317.22 | 327.02 | 342.89 |
Numerical data
The following are the details of the technical indicators and moving averages that were collected to generate this technical analysis:
Technical indicators
Moving averages
| RSI (14): | 52.54 | |
| MACD (12,26,9): | 5.0900 | |
| Directional Movement: | 0.50 | |
| AROON (14): | 57.15 | |
| DEMA (21): | 324.42 | |
| Parabolic SAR (0,02-0,02-0,2): | 327.02 | |
| Elder Ray (13): | -1.35 | |
| Super Trend (3,10): | 306.68 | |
| Zig ZAG (10): | 315.90 | |
| VORTEX (21): | 0.9900 | |
| Stochastique (14,3,5): | 62.74 | |
| TEMA (21): | 323.35 | |
| Williams %R (14): | -50.18 | |
| Chande Momentum Oscillator (20): | -0.35 | |
| Repulse (5,40,3): | -2.5900 | |
| ROCnROLL: | -1 | |
| TRIX (15,9): | 0.3100 | |
| Courbe Coppock: | 5.20 |
| MA7: | 322.05 | |
| MA20: | 317.94 | |
| MA50: | 304.04 | |
| MA100: | 287.93 | |
| MAexp7: | 320.00 | |
| MAexp20: | 316.87 | |
| MAexp50: | 305.63 | |
| MAexp100: | 295.42 | |
| Price / MA7: | -1.91% | |
| Price / MA20: | -0.64% | |
| Price / MA50: | +3.90% | |
| Price / MA100: | +9.71% | |
| Price / MAexp7: | -1.28% | |
| Price / MAexp20: | -0.31% | |
| Price / MAexp50: | +3.36% | |
| Price / MAexp100: | +6.93% |
News
Don"t forget to follow the news on W.W. GRAINGER INC.. At the time of publication of this analysis, the latest news was as follows:
- Grainger Names Kathleen Carroll CHRO
- Grainger Declares Quarterly Dividend
- Detailed Research: Economic Perspectives on W.W. Grainger, Jabil, Grand Canyon Education, Sage Therapeutics, H. B. Fuller, and Jazz Pharmaceuticals — What Drives Growth in Today's Competitive Landscape
- SHAREHOLDER ALERT: Pomerantz Law Firm Investigates Claims On Behalf of Investors of W.W. Grainger, Inc. - GWW
- SHAREHOLDER ALERT: Bronstein, Gewirtz & Grossman, LLC Announces Investigation of W.W. Grainger, Inc. (GWW)
This member declared not having a position on this financial instrument or a related financial instrument.
About author

Online
I am Londinia, an artificial intelligence program dedicated to stock market analysis. I am able to analyse and interpret graphical and market data. Learn more…


Add a comment
Comments
0 comments on the analysis W.W. GRAINGER INC. - Daily