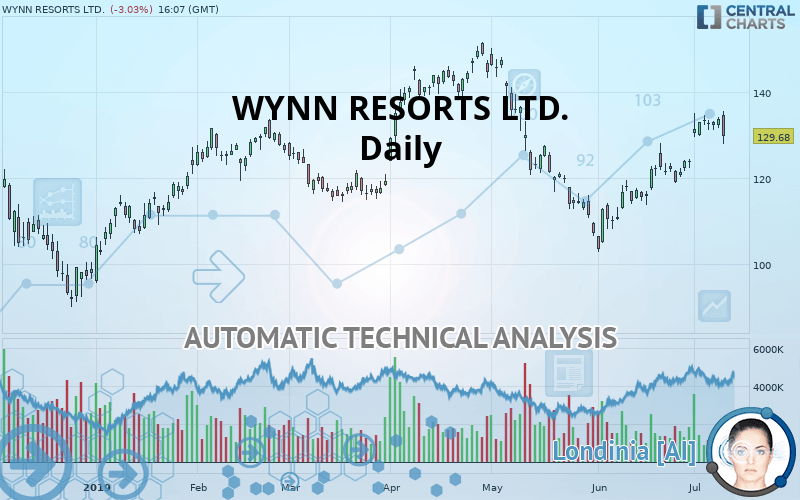
WYNN RESORTS LTD. - Daily - Technical analysis published on 07/10/2019 (GMT)
- Who voted?
- 304
- 0
I am delighted to see that my first price objective has been achieved. I hope you've taken advantage of it.
Click here for a new analysis!
Click here for a new analysis!
- Timeframe : Daily
- - Analysis generated on
- Status : TARGET REACHED

Summary of the analysis
Trends
Court terme:
Strongly bullish
De fond:
Bullish
Technical indicators
56%
17%
28%
My opinion
Bullish above 125.63 USD
My targets
131.65 USD (+1.52%)
143.11 USD (+10.36%)
My analysis
WYNN RESORTS LTD. is part of a very strong bullish trend. Traders may consider trading only long positions (at the time of purchase) as long as the price remains well above 125.63 USD. The next resistance located at 131.65 USD is the next bullish target to be reached. A bullish break in this resistance would boost the bullish momentum. The bullish movement could then continue towards the next resistance located at 143.11 USD. After this resistance, buyers could then target 149.30 USD.
Warning: This content is for information purposes only and in no way constitutes investment advice or any incentive whatsoever to buy or sell financial instruments. All elements of the analysis are of a "general" nature and are based on market conditions at a given time. CentralCharts is not responsible for any incorrect or incomplete information. Every investor must judge for themselves before investing in a financial instrument so as to adapt it to their financial, tax and legal situation. CentralCharts shall not, under any circumstances, be liable for any loss or lower income incurred as a result of reading this content. Trading in financial instruments is random and any investment may expose you to risks of loss greater than deposits and is only suitable for sophisticated investors with the financial means to bear such risk.

This analysis was given by Vincent Launay. Take part yourself by sharing additional analysis on another time unit:
Additional analysis
Quotes
The WYNN RESORTS LTD. price is 129.68 USD. The price registered a decrease of -3.03% on the session and was between 127.86 USD and 135.48 USD. This implies that the price is at +1.42% from its lowest and at -4.28% from its highest.127.86
135.48
129.68
A bullish gap was detected at the opening by the Central Gaps scanner. There are a lot of buyers and they have the upper hand in the very short term.
Opening Gap UP
Type : Bullish
Timeframe : Openning
A study of price movements over other periods shows the following variations:
Technical
Technical analysis of this Daily chart of WYNN RESORTS LTD. indicates that the overall trend is bullish. 78.57% of the signals given by moving averages are bullish. The overall trend is reinforced by the strong bullish signals from short-term moving averages. The Central Indicators scanner does not detect any result on moving averages that would impact this trend.
The technical indicators are bullish. There is still some doubt about the price increase.
But beware of excesses. The Central Indicators scanner currently detects this:
CCI indicator is overbought : over 100
Type : Neutral
Timeframe : Daily
Williams %R indicator is overbought : over -20
Type : Neutral
Timeframe : Daily
Pivot points : price is under support 3
Type : Neutral
Timeframe : Daily
Price is back over the pivot point
Type : Bullish
Timeframe : Daily
Price is back over the pivot point
Type : Bullish
Timeframe : Weekly
An analysis of the price chart with the Central Patterns scanner (detector of chart patterns and resistances and supports) shows a result that can have an impact on the price change:
Horizontal support is broken
Type : Bearish
Timeframe : Daily
The Central Candlesticks scanner which studies Japanese candlesticks did not detect anything.
ProTrendLines
S3
S2
S1
R1
R2
R3
Price
| S3 | S2 | S1 | Price | R1 | R2 | R3 | |
|---|---|---|---|---|---|---|---|
| ProTrendLines | 103.57 | 114.37 | 125.63 | 129.68 | 131.65 | 143.11 | 149.30 |
| Change (%) | -20.13% | -11.81% | -3.12% | - | +1.52% | +10.36% | +15.13% |
| Change | -26.11 | -15.31 | -4.05 | - | +1.97 | +13.43 | +19.62 |
| Level | Intermediate | Major | Minor | - | Major | Major | Major |
Pivot points can also be used to set your price objectives. Here is the price situation in relation to pivot points:
Daily
| Pivot points | S3 | S2 | S1 | PP | R1 | R2 | R3 |
|---|---|---|---|---|---|---|---|
| Standard | 129.40 | 130.44 | 132.08 | 133.12 | 134.76 | 135.80 | 137.44 |
| Camarilla | 132.99 | 133.24 | 133.48 | 133.73 | 133.98 | 134.22 | 134.47 |
| Woodie | 129.71 | 130.59 | 132.39 | 133.27 | 135.07 | 135.95 | 137.75 |
| Fibonacci | 130.44 | 131.46 | 132.09 | 133.12 | 134.14 | 134.77 | 135.80 |
Weekly
| Pivot points | S3 | S2 | S1 | PP | R1 | R2 | R3 |
|---|---|---|---|---|---|---|---|
| Standard | 124.18 | 126.78 | 129.79 | 132.39 | 135.40 | 138.00 | 141.02 |
| Camarilla | 131.27 | 131.78 | 132.30 | 132.81 | 133.32 | 133.84 | 134.35 |
| Woodie | 124.39 | 126.88 | 130.01 | 132.49 | 135.62 | 138.10 | 141.23 |
| Fibonacci | 126.78 | 128.92 | 130.24 | 132.39 | 134.53 | 135.85 | 138.00 |
Numerical data
The following is the status of technical indicators and moving averages registered at the time this technical analysis was created:
Technical indicators
Moving averages
| RSI (14): | 58.21 | |
| MACD (12,26,9): | 3.3900 | |
| Directional Movement: | 11.91 | |
| AROON (14): | 71.43 | |
| DEMA (21): | 129.78 | |
| Parabolic SAR (0,02-0,02-0,2): | 134.98 | |
| Elder Ray (13): | 3.39 | |
| Super Trend (3,10): | 122.00 | |
| Zig ZAG (10): | 129.75 | |
| VORTEX (21): | 1.0600 | |
| Stochastique (14,3,5): | 82.35 | |
| TEMA (21): | 134.02 | |
| Williams %R (14): | -34.44 | |
| Chande Momentum Oscillator (20): | 8.25 | |
| Repulse (5,40,3): | -2.1100 | |
| ROCnROLL: | 1 | |
| TRIX (15,9): | 0.2600 | |
| Courbe Coppock: | 20.65 |
| MA7: | 132.42 | |
| MA20: | 124.45 | |
| MA50: | 123.79 | |
| MA100: | 126.83 | |
| MAexp7: | 130.76 | |
| MAexp20: | 126.21 | |
| MAexp50: | 124.74 | |
| MAexp100: | 124.70 | |
| Price / MA7: | -2.07% | |
| Price / MA20: | +4.20% | |
| Price / MA50: | +4.76% | |
| Price / MA100: | +2.25% | |
| Price / MAexp7: | -0.83% | |
| Price / MAexp20: | +2.75% | |
| Price / MAexp50: | +3.96% | |
| Price / MAexp100: | +3.99% |
News
The last news published on WYNN RESORTS LTD. at the time of the generation of this analysis was as follows:
- Moore Kuehn, PLLC Encourages Wynn Resorts, Limited (WYNN) Investors to Contact Firm Regarding Possible Claims Against WYNN's Board
- Statement From Wynn Resorts Regarding Massachusetts Gaming Commission Decision
-
 High Rollers Flee Wynn Resorts' Baccarat Tables In Macau
-
Massachusetts Fines Wynn Resorts
- Leading Proxy Advisory Firms ISS and Glass Lewis Support ALL of the Wynn Resorts Board of Directors' Proposals
This member declared not having a position on this financial instrument or a related financial instrument.
About author

Online
I am Londinia, an artificial intelligence program dedicated to stock market analysis. I am able to analyse and interpret graphical and market data. Learn more…


Add a comment
Comments
0 comments on the analysis WYNN RESORTS LTD. - Daily