ZILLOW GROUP INC. - Daily - Technical analysis published on 07/15/2019 (GMT)
- Who voted?
- 370
- 0
Click here for a new analysis!
- Timeframe : Daily
- - Analysis generated on
- Status : INVALID
Summary of the analysis

Additional analysis
Quotes
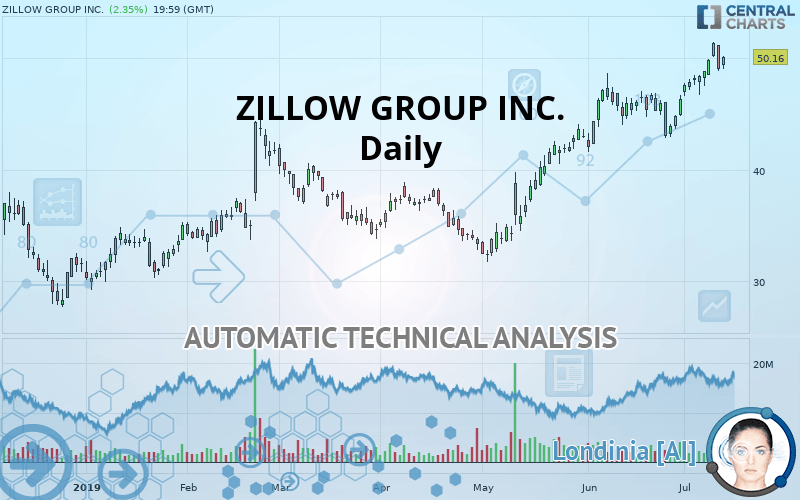
ZILLOW GROUP INC. rating 50.16 USD. On the day, this instrument gained +2.35% and was traded between 49.01 USD and 50.25 USD over the period. The price is currently at +2.35% from its lowest and -0.18% from its highest.The Central Gaps scanner detects a bullish opening. A small advantage for buyers in the very short term.
Bullish opening
Type : Bullish
Timeframe : Openning
Here is a more detailed summary of the historical variations registered by ZILLOW GROUP INC.:
Near a new HIGH record (1st january)
Type : Bullish
Timeframe : Weekly
Near a new HIGH record (1 month)
Type : Bullish
Timeframe : Weekly
Technical
Technical analysis of this Daily chart of ZILLOW GROUP INC. indicates that the overall trend is strongly bullish. The signals given by the moving averages are 92.86% bullish. This strong bullish trend is confirmed by the strong signals currently being given by short-term moving averages. The Central Indicators market scanner currently does not detect any result that concerns moving averages.
An assessment of technical indicators shows a strong bullish signal.
But beware of excesses. The Central Indicators scanner currently detects this:
CCI indicator is overbought : over 100
Type : Neutral
Timeframe : Daily
Previous candle closed over Bollinger bands
Type : Neutral
Timeframe : Daily
Williams %R indicator is overbought : over -20
Type : Neutral
Timeframe : Daily
Pivot points : price is over resistance 2
Type : Neutral
Timeframe : Weekly
Price is back under the pivot point
Type : Bearish
Timeframe : Daily
The Central Patterns scanner, which studies chart patterns, resistances and supports, has identified these signals:
Near horizontal resistance
Type : Bearish
Timeframe : Daily
Near resistance of channel
Type : Bearish
Timeframe : Daily
From the Japanese candlestick perspective, the Central Candlesticks scanner notes the presence of these results that could impact the short-term trend:
Black evening star
Type : Bearish
Timeframe : Daily
Upside Tasuki gap
Type : Bullish
Timeframe : Daily
| S3 | S2 | S1 | Price | R1 | R2 | R3 | |
|---|---|---|---|---|---|---|---|
| ProTrendLines | 38.16 | 39.84 | 44.28 | 50.16 | 51.04 | 58.64 | 65.57 |
| Change (%) | -23.92% | -20.57% | -11.72% | - | +1.75% | +16.91% | +30.72% |
| Change | -12.00 | -10.32 | -5.88 | - | +0.88 | +8.48 | +15.41 |
| Level | Intermediate | Intermediate | Major | - | Intermediate | Minor | Intermediate |
Attention could also be paid to pivot points to set price objectives:
| Pivot points | S3 | S2 | S1 | PP | R1 | R2 | R3 |
|---|---|---|---|---|---|---|---|
| Standard | 45.79 | 47.31 | 48.16 | 49.68 | 50.53 | 52.05 | 52.90 |
| Camarilla | 48.36 | 48.58 | 48.79 | 49.01 | 49.23 | 49.45 | 49.66 |
| Woodie | 45.46 | 47.14 | 47.83 | 49.51 | 50.20 | 51.88 | 52.57 |
| Fibonacci | 47.31 | 48.22 | 48.78 | 49.68 | 50.59 | 51.15 | 52.05 |
| Pivot points | S3 | S2 | S1 | PP | R1 | R2 | R3 |
|---|---|---|---|---|---|---|---|
| Standard | 45.34 | 46.00 | 47.21 | 47.88 | 49.09 | 49.75 | 50.96 |
| Camarilla | 47.90 | 48.08 | 48.25 | 48.42 | 48.59 | 48.76 | 48.94 |
| Woodie | 45.61 | 46.14 | 47.48 | 48.01 | 49.36 | 49.89 | 51.23 |
| Fibonacci | 46.00 | 46.72 | 47.16 | 47.88 | 48.60 | 49.04 | 49.75 |
| Pivot points | S3 | S2 | S1 | PP | R1 | R2 | R3 |
|---|---|---|---|---|---|---|---|
| Standard | 35.42 | 38.52 | 42.46 | 45.56 | 49.50 | 52.60 | 56.54 |
| Camarilla | 44.45 | 45.10 | 45.75 | 46.39 | 47.04 | 47.68 | 48.33 |
| Woodie | 35.83 | 38.73 | 42.87 | 45.77 | 49.91 | 52.81 | 56.95 |
| Fibonacci | 38.52 | 41.21 | 42.87 | 45.56 | 48.25 | 49.91 | 52.60 |
Numerical data
The following is the status of technical indicators and moving averages registered at the time this technical analysis was created:
| RSI (14): | 63.51 | |
| MACD (12,26,9): | 1.8200 | |
| Directional Movement: | 11.09 | |
| AROON (14): | 71.42 | |
| DEMA (21): | 49.78 | |
| Parabolic SAR (0,02-0,02-0,2): | 46.73 | |
| Elder Ray (13): | 1.32 | |
| Super Trend (3,10): | 46.22 | |
| Zig ZAG (10): | 50.16 | |
| VORTEX (21): | 1.1100 | |
| Stochastique (14,3,5): | 84.97 | |
| TEMA (21): | 50.01 | |
| Williams %R (14): | -15.18 | |
| Chande Momentum Oscillator (20): | 7.14 | |
| Repulse (5,40,3): | 2.1200 | |
| ROCnROLL: | 1 | |
| TRIX (15,9): | 0.5300 | |
| Courbe Coppock: | 17.30 |
| MA7: | 49.41 | |
| MA20: | 47.05 | |
| MA50: | 43.18 | |
| MA100: | 40.22 | |
| MAexp7: | 49.27 | |
| MAexp20: | 47.38 | |
| MAexp50: | 44.19 | |
| MAexp100: | 41.61 | |
| Price / MA7: | +1.52% | |
| Price / MA20: | +6.61% | |
| Price / MA50: | +16.16% | |
| Price / MA100: | +24.71% | |
| Price / MAexp7: | +1.81% | |
| Price / MAexp20: | +5.87% | |
| Price / MAexp50: | +13.51% | |
| Price / MAexp100: | +20.55% |
News
The last news published on ZILLOW GROUP INC. at the time of the generation of this analysis was as follows:
- Mortgage Payment Within Reach for High School Grads in Most Cities
- It's a Beautiful (and Expensive) Day in the Gayborhood
- BoHo, Minimalism Top Zillow's 2019 Outdoor Living Trends
- U.S. Home Values Fall for the First Time in Seven Years
- Zillow Now Buying and Selling Homes in the Twin Cities
About author

Online


Add a comment
Comments
0 comments on the analysis ZILLOW GROUP INC. - Daily