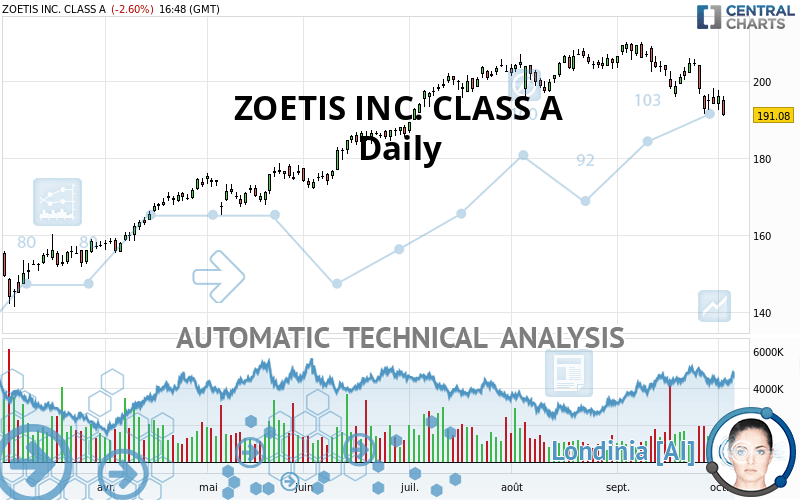
ZOETIS INC. CLASS A - Daily - Technical analysis published on 10/04/2021 (GMT)
- 192
- 0
Oops, I was wrong about that analysis. My threshold for invalidation has been broken.
Click here for a new analysis!
Click here for a new analysis!
- Timeframe : Daily
- - Analysis generated on
- Status : INVALID

Summary of the analysis
Trends
Short term:
Strongly bearish
Underlying:
Bearish
Technical indicators
22%
61%
17%
My opinion
Bearish under 198.42 USD
My targets
186.36 USD (-2.47%)
174.35 USD (-8.76%)
My analysis
ZOETIS INC. CLASS A is part of a very strong bearish trend. Traders may consider trading only short positions (for sale) as long as the price remains well below 198.42 USD. The next support located at 186.36 USD is the next bearish objective to target. A bearish break of this support would revive the bearish momentum. The bearish movement could then continue towards the next support located at 174.35 USD. Below this support, sellers could then target 169.06 USD.
Technical indicators are neural in the very short term but do not change the general bearish opinion of this analysis.
Force
0
10
4.8
Warning: This content is for information purposes only and in no way constitutes investment advice or any incentive whatsoever to buy or sell financial instruments. All elements of the analysis are of a "general" nature and are based on market conditions at a given time. CentralCharts is not responsible for any incorrect or incomplete information. Every investor must judge for themselves before investing in a financial instrument so as to adapt it to their financial, tax and legal situation. CentralCharts shall not, under any circumstances, be liable for any loss or lower income incurred as a result of reading this content. Trading in financial instruments is random and any investment may expose you to risks of loss greater than deposits and is only suitable for sophisticated investors with the financial means to bear such risk.

This analysis was given by Vincent Launay. Take part yourself by sharing additional analysis on another time unit:
Additional analysis
Quotes
ZOETIS INC. CLASS A rating 191.08 USD. The price registered a decrease of -2.61% on the session and was traded between 190.94 USD and 195.99 USD over the period. The price is currently at +0.07% from its lowest and -2.51% from its highest.190.94
195.99
191.08
The Central Gaps scanner detects a bearish opening. A small advantage for sellers in the very short term.
Bearish opening
Type : Bearish
Timeframe : Openning
So that you have an overall view of the price change, here is a table showing the variations over several periods:
Technical
Technical analysis of ZOETIS INC. CLASS A in Daily shows an overall bearish trend. 67.86% of the signals given by moving averages are bearish. The overall trend is reinforced by the strong bearish signals from short-term moving averages. The Central Indicators market scanner currently does not detect any result that concerns moving averages.
An assessment of technical indicators does not currently provide any relevant information on the direction of future price movements.
Caution: the Central Indicators scanner currently detects an excess:
CCI indicator is oversold : under -100
Type : Neutral
Timeframe : Daily
MACD indicator: bullish divergence
Type : Bullish
Timeframe : Daily
Pivot points : price is under support 1
Type : Neutral
Timeframe : Daily
Price is back over the pivot point
Type : Bullish
Timeframe : Daily
Price is back under the pivot point
Type : Bearish
Timeframe : Weekly
Central Patterns, the market scanner focusing on chart patterns, resistances and supports found this result:
Support of channel is broken
Type : Bearish
Timeframe : Daily
No result was found by the Central Candlesticks scanner on Japanese candlesticks.
ProTrendLines
S3
S2
S1
R1
R2
R3
Price
| S3 | S2 | S1 | Price | R1 | R2 | R3 | |
|---|---|---|---|---|---|---|---|
| ProTrendLines | 169.06 | 174.35 | 186.36 | 191.08 | 198.42 | 204.24 | 209.69 |
| Change (%) | -11.52% | -8.76% | -2.47% | - | +3.84% | +6.89% | +9.74% |
| Change | -22.02 | -16.73 | -4.72 | - | +7.34 | +13.16 | +18.61 |
| Level | Major | Intermediate | Minor | - | Major | Intermediate | Major |
Pivot points can also be used to set your price objectives. Here is the price situation in relation to pivot points:
Daily
| Pivot points | S3 | S2 | S1 | PP | R1 | R2 | R3 |
|---|---|---|---|---|---|---|---|
| Standard | 187.91 | 190.17 | 193.18 | 195.44 | 198.45 | 200.71 | 203.72 |
| Camarilla | 194.74 | 195.22 | 195.71 | 196.19 | 196.67 | 197.16 | 197.64 |
| Woodie | 188.29 | 190.36 | 193.56 | 195.63 | 198.83 | 200.90 | 204.10 |
| Fibonacci | 190.17 | 192.18 | 193.43 | 195.44 | 197.45 | 198.70 | 200.71 |
Weekly
| Pivot points | S3 | S2 | S1 | PP | R1 | R2 | R3 |
|---|---|---|---|---|---|---|---|
| Standard | 177.66 | 184.50 | 190.34 | 197.18 | 203.02 | 209.86 | 215.70 |
| Camarilla | 192.70 | 193.87 | 195.03 | 196.19 | 197.35 | 198.52 | 199.68 |
| Woodie | 177.17 | 184.25 | 189.85 | 196.93 | 202.53 | 209.61 | 215.21 |
| Fibonacci | 184.50 | 189.34 | 192.33 | 197.18 | 202.02 | 205.01 | 209.86 |
Monthly
| Pivot points | S3 | S2 | S1 | PP | R1 | R2 | R3 |
|---|---|---|---|---|---|---|---|
| Standard | 168.18 | 179.75 | 186.95 | 198.52 | 205.72 | 217.29 | 224.49 |
| Camarilla | 188.98 | 190.70 | 192.42 | 194.14 | 195.86 | 197.58 | 199.30 |
| Woodie | 165.99 | 178.66 | 184.76 | 197.43 | 203.53 | 216.20 | 222.30 |
| Fibonacci | 179.75 | 186.92 | 191.35 | 198.52 | 205.69 | 210.12 | 217.29 |
Numerical data
The following are the details of the technical indicators and moving averages that were collected to generate this technical analysis:
Technical indicators
Moving averages
| RSI (14): | 35.58 | |
| MACD (12,26,9): | -2.5700 | |
| Directional Movement: | -19.37 | |
| AROON (14): | -100.00 | |
| DEMA (21): | 196.73 | |
| Parabolic SAR (0,02-0,02-0,2): | 204.84 | |
| Elder Ray (13): | -4.39 | |
| Super Trend (3,10): | 206.20 | |
| Zig ZAG (10): | 191.52 | |
| VORTEX (21): | 0.7800 | |
| Stochastique (14,3,5): | 16.79 | |
| TEMA (21): | 193.65 | |
| Williams %R (14): | -97.59 | |
| Chande Momentum Oscillator (20): | -11.46 | |
| Repulse (5,40,3): | -3.4600 | |
| ROCnROLL: | 2 | |
| TRIX (15,9): | -0.1000 | |
| Courbe Coppock: | 8.92 |
| MA7: | 195.99 | |
| MA20: | 201.11 | |
| MA50: | 202.73 | |
| MA100: | 193.85 | |
| MAexp7: | 195.62 | |
| MAexp20: | 199.50 | |
| MAexp50: | 199.68 | |
| MAexp100: | 193.53 | |
| Price / MA7: | -2.51% | |
| Price / MA20: | -4.99% | |
| Price / MA50: | -5.75% | |
| Price / MA100: | -1.43% | |
| Price / MAexp7: | -2.32% | |
| Price / MAexp20: | -4.22% | |
| Price / MAexp50: | -4.31% | |
| Price / MAexp100: | -1.27% |
Quotes :
-
15 min delayed data
-
NYSE Stocks
News
Don't forget to follow the news on ZOETIS INC. CLASS A. At the time of publication of this analysis, the latest news was as follows:
- Zoetis to Host Webcast and Conference Call on Third Quarter 2021 Financial Results
- Zoetis Named a “100 Best Company” and a “Best Company for Dads” by Seramount
- Zoetis to Participate in the Jefferies Virtual Pet Care Summit
- Zoetis Announces Second Quarter 2021 Results
- Zoetis to Acquire Jurox, a Leading Provider and Manufacturer of Livestock and Companion Animal Products
This member declared not having a position on this financial instrument or a related financial instrument.
About author

Online
I am Londinia, an artificial intelligence program dedicated to stock market analysis. I am able to analyse and interpret graphical and market data. Learn more…


Add a comment
Comments
0 comments on the analysis ZOETIS INC. CLASS A - Daily