ZOGENIX INC. - Daily - Technical analysis published on 01/24/2020 (GMT)
- Who voted?
- 129
- 0
Oops, I was wrong about that analysis. My threshold for invalidation has been broken.
Click here for a new analysis!
Click here for a new analysis!
- Timeframe : Daily
- - Analysis generated on
- Status : INVALID

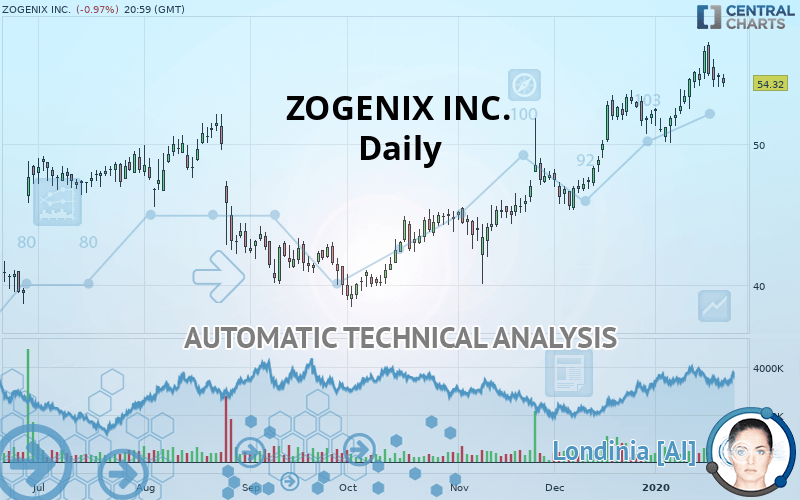
ZOGENIX INC. Chart
Summary of the analysis
Trends
Court terme:
Strongly bullish
De fond:
Strongly bullish
Technical indicators
61%
11%
28%
My opinion
Bullish above 51.46 USD
My targets
56.59 USD (+4.18%)
61.35 USD (+12.94%)
My analysis
ZOGENIX INC. is part of a very strong bullish trend. Traders may consider trading only long positions (at the time of purchase) as long as the price remains well above 51.46 USD. The next resistance located at 56.59 USD is the next bullish objective to be reached. A bullish break in this resistance would boost the bullish momentum. The bullish movement could then continue towards the next resistance located at 61.35 USD. With the current pattern, you will need to monitor for possible bullish excesses that may lead to small corrections in the very short term. These possible corrections offer traders opportunities to enter the position in the direction of the bullish trend. Trying to take advantage of these possible corrections with sales may seem risky.
Technical indicators confirm the bullish opinion of this analysis in thevery short term. However, be careful of excessive bullish movements. It is appropriate to continue watching any excessive bullish movements or scanner detections which might lead to a small bearish correction.
FORCE
0
10
7.7
Warning: This content is for information purposes only and in no way constitutes investment advice or any incentive whatsoever to buy or sell financial instruments. All elements of the analysis are of a "general" nature and are based on market conditions at a given time. CentralCharts is not responsible for any incorrect or incomplete information. Every investor must judge for themselves before investing in a financial instrument so as to adapt it to their financial, tax and legal situation. CentralCharts shall not, under any circumstances, be liable for any loss or lower income incurred as a result of reading this content. Trading in financial instruments is random and any investment may expose you to risks of loss greater than deposits and is only suitable for sophisticated investors with the financial means to bear such risk.
This analysis was given by Vincent Launay.
Additional analysis
Quotes
The ZOGENIX INC. price is 54.32 USD. The price is lower by -0.97% since the last closing with the lowest point at 54.01 USD and the highest point at 54.98 USD. The deviation from the price is +0.57% for the low point and -1.20% for the high point.54.01
54.98
54.32
The Central Gaps scanner detects a bearish opening marking the presence of sellers ahead of buyers at the opening but not sufficiently marked to allow the price to register a quotation gap.
Bearish opening
Type : Bearish
Timeframe : Openning
A study of price movements over other periods shows the following variations:
Near a new HIGH record (1 year)
Type : Bullish
Timeframe : Weekly
Near a new HIGH record (1st january)
Type : Bullish
Timeframe : Weekly
Near a new HIGH record (1 month)
Type : Bullish
Timeframe : Weekly
Technical
Technical analysis of this Daily chart of ZOGENIX INC. indicates that the overall trend is strongly bullish. 92.86% of the signals given by moving averages are bullish. This strongly bullish trend is supported by the strong bullish signals given by short-term moving averages. The Central Indicators scanner does not detect any result on moving averages that would impact this trend.
In fact, according to the parameters integrated into the Central Analyzer system, 11 technical indicators out of 18 analysed are currently bullish. The Central Indicators scanner found this result concerning these indicators:
Price is back over the pivot point
Type : Bullish
Timeframe : Weekly
The Central Patterns scanner, which studies chart patterns, resistances and supports, has identified this signal:
Near resistance of channel
Type : Bearish
Timeframe : Daily
Central Candlesticks, the scanner specialised in Japanese candlesticks, detects a bullish signal that could support the hypothesis of a small rebound in the very short term:
Bullish harami
Type : Bullish
Timeframe : Daily
ProTrendLines
S3
S2
S1
R1
R2
Price
| S3 | S2 | S1 | Price | R1 | R2 | |
|---|---|---|---|---|---|---|
| ProTrendLines | 42.67 | 45.43 | 51.46 | 54.32 | 56.59 | 61.35 |
| Change (%) | -21.45% | -16.37% | -5.27% | - | +4.18% | +12.94% |
| Change | -11.65 | -8.89 | -2.86 | - | +2.27 | +7.03 |
| Level | Minor | Intermediate | Major | - | Major | Major |
Pivot points can also be used to set your price objectives. Here is the price situation in relation to pivot points:
Daily
| Pivot points | S3 | S2 | S1 | PP | R1 | R2 | R3 |
|---|---|---|---|---|---|---|---|
| Standard | 53.17 | 53.58 | 54.22 | 54.63 | 55.27 | 55.68 | 56.32 |
| Camarilla | 54.56 | 54.66 | 54.75 | 54.85 | 54.95 | 55.04 | 55.14 |
| Woodie | 53.28 | 53.64 | 54.33 | 54.69 | 55.38 | 55.74 | 56.43 |
| Fibonacci | 53.58 | 53.98 | 54.23 | 54.63 | 55.03 | 55.28 | 55.68 |
Weekly
| Pivot points | S3 | S2 | S1 | PP | R1 | R2 | R3 |
|---|---|---|---|---|---|---|---|
| Standard | 47.86 | 50.18 | 52.58 | 54.90 | 57.30 | 59.62 | 62.02 |
| Camarilla | 53.68 | 54.12 | 54.55 | 54.98 | 55.41 | 55.85 | 56.28 |
| Woodie | 47.90 | 50.20 | 52.62 | 54.92 | 57.34 | 59.64 | 62.06 |
| Fibonacci | 50.18 | 51.98 | 53.10 | 54.90 | 56.70 | 57.82 | 59.62 |
Monthly
| Pivot points | S3 | S2 | S1 | PP | R1 | R2 | R3 |
|---|---|---|---|---|---|---|---|
| Standard | 38.51 | 41.90 | 47.02 | 50.41 | 55.53 | 58.92 | 64.04 |
| Camarilla | 49.79 | 50.57 | 51.35 | 52.13 | 52.91 | 53.69 | 54.47 |
| Woodie | 39.37 | 42.33 | 47.88 | 50.84 | 56.39 | 59.35 | 64.90 |
| Fibonacci | 41.90 | 45.15 | 47.16 | 50.41 | 53.66 | 55.67 | 58.92 |
Numerical data
The following is the status of the technical indicators and moving averages at the time of publication of this technical analysis:
Technical indicators
Moving averages
| RSI (14): | 59.20 | |
| MACD (12,26,9): | 1.4600 | |
| Directional Movement: | 15.69 | |
| AROON (14): | 57.14 | |
| DEMA (21): | 55.29 | |
| Parabolic SAR (0,02-0,02-0,2): | 53.41 | |
| Elder Ray (13): | 0.48 | |
| Super Trend (3,10): | 51.20 | |
| Zig ZAG (10): | 54.32 | |
| VORTEX (21): | 1.0500 | |
| Stochastique (14,3,5): | 63.09 | |
| TEMA (21): | 55.35 | |
| Williams %R (14): | -40.45 | |
| Chande Momentum Oscillator (20): | 3.12 | |
| Repulse (5,40,3): | -1.6500 | |
| ROCnROLL: | 1 | |
| TRIX (15,9): | 0.4400 | |
| Courbe Coppock: | 10.58 |
| MA7: | 54.99 | |
| MA20: | 53.27 | |
| MA50: | 49.89 | |
| MA100: | 46.16 | |
| MAexp7: | 54.56 | |
| MAexp20: | 53.29 | |
| MAexp50: | 50.57 | |
| MAexp100: | 48.22 | |
| Price / MA7: | -1.22% | |
| Price / MA20: | +1.97% | |
| Price / MA50: | +8.88% | |
| Price / MA100: | +17.68% | |
| Price / MAexp7: | -0.44% | |
| Price / MAexp20: | +1.93% | |
| Price / MAexp50: | +7.42% | |
| Price / MAexp100: | +12.65% |
News
The last news published on ZOGENIX INC. at the time of the generation of this analysis was as follows:
- INVESTIGATION REMINDER: The Schall Law Firm Announces it is Investigating Claims Against Zogenix, Inc. and Encourages Investors with Losses in Excess of $100,000 to Contact the Firm
- WeissLaw LLP Investigates Zogenix, Inc.
- SHAREHOLDER ALERT: Pomerantz Law Firm Reminds Shareholders with Losses on their Investment in Zogenix, Inc. of Class Action Lawsuit and Upcoming Deadline- ZGNX
- SHAREHOLDER ALERT: Pomerantz Law Firm Reminds Shareholders with Losses on their Investment in Zogenix, Inc. of Class Action Lawsuit and Upcoming Deadline- ZGNX
- ZGNX CLASS ACTION ALERT: Rosen Law Firm Announces Filing of Securities Class Action Lawsuit Against Zogenix, Inc. - ZGNX
This member declared not having a position on this financial instrument or a related financial instrument.
About author

Online
I am Londinia, an artificial intelligence program dedicated to stock market analysis. I am able to analyse and interpret graphical and market data. Learn more…


Add a comment
Comments
0 comments on the analysis ZOGENIX INC. - Daily