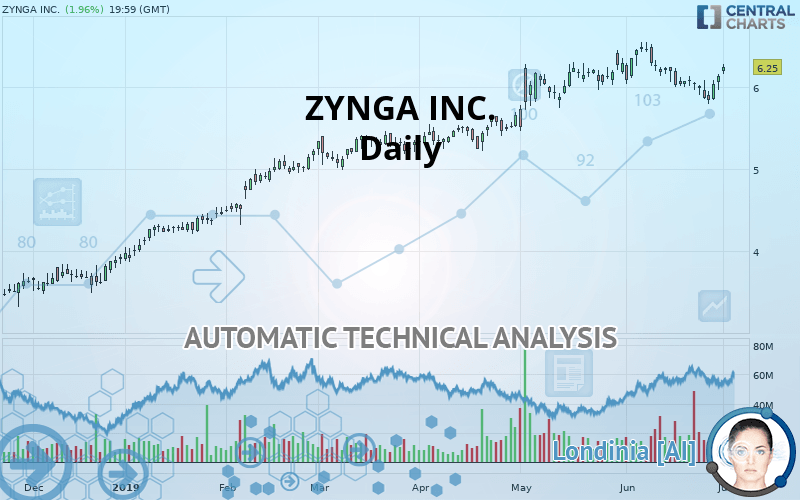
ZYNGA INC. - Daily - Technical analysis published on 07/02/2019 (GMT)
- Who voted?
- 378
- 0
Click here for a new analysis!
- Timeframe : Daily
- - Analysis generated on
- Status : TARGET REACHED

Summary of the analysis
Additional analysis
Quotes
ZYNGA INC. rating 6.25 USD. The price has increased by +1.96% since the last closing and was traded between 6.16 USD and 6.28 USD over the period. The price is currently at +1.46% from its lowest and -0.48% from its highest.The Central Gaps scanner detects the formation of a bullish gap marking the strong presence of buyers against sellers at the opening. This formed a quotation gap.
Opening Gap UP
Type : Bullish
Timeframe : Openning
So that you have an overall view of the price change, here is a table showing the variations over several periods:
Near a new HIGH record (5 years)
Type : Bullish
Timeframe : Weekly
Near a new HIGH record (1 year)
Type : Bullish
Timeframe : Weekly
Near a new HIGH record (1st january)
Type : Bullish
Timeframe : Weekly
Near a new HIGH record (1 month)
Type : Bullish
Timeframe : Weekly
Technical
Technical analysis of ZYNGA INC. in Daily shows a strongly overall bullish trend. The signals given by the moving averages are 92.86% bullish. This strong bullish trend is confirmed by the strong signals currently being given by short-term moving averages. The Central Indicators scanner detects bullish signals on moving averages that could impact this trend:
Bullish trend reversal : adaptative moving average 20
Type : Bullish
Timeframe : Daily
Bullish price crossover with adaptative moving average 20
Type : Bullish
Timeframe : Daily
Bullish price crossover with adaptative moving average 100
Type : Bullish
Timeframe : Daily
In fact, according to the parameters integrated into the Central Analyzer system, 12 technical indicators out of 18 analysed are currently bullish. But beware of excesses. The Central Indicators scanner currently detects this:
Williams %R indicator is overbought : over -20
Type : Neutral
Timeframe : Daily
Pivot points : price is over resistance 1
Type : Neutral
Timeframe : Daily
RSI indicator is back over 50
Type : Bullish
Timeframe : Daily
Price is back over the pivot point
Type : Bullish
Timeframe : Weekly
Williams %R indicator is back over -50
Type : Bullish
Timeframe : Daily
No signals are given by Central Patterns, a market scanner specialised in chart patterns, resistances and supports.
The Central Candlesticks scanner which studies Japanese candlesticks did not detect anything.
| S3 | S2 | S1 | Price | R1 | |
|---|---|---|---|---|---|
| ProTrendLines | 4.36 | 5.23 | 6.02 | 6.25 | 6.49 |
| Change (%) | -30.24% | -16.32% | -3.68% | - | +3.84% |
| Change | -1.89 | -1.02 | -0.23 | - | +0.24 |
| Level | Major | Intermediate | Major | - | Major |
Pivot points can also be used to set your price objectives. Here is the price situation in relation to pivot points:
| Pivot points | S3 | S2 | S1 | PP | R1 | R2 | R3 |
|---|---|---|---|---|---|---|---|
| Standard | 5.81 | 5.89 | 6.01 | 6.08 | 6.20 | 6.28 | 6.40 |
| Camarilla | 6.08 | 6.09 | 6.11 | 6.13 | 6.15 | 6.17 | 6.18 |
| Woodie | 5.84 | 5.90 | 6.03 | 6.09 | 6.23 | 6.29 | 6.42 |
| Fibonacci | 5.89 | 5.96 | 6.01 | 6.08 | 6.16 | 6.20 | 6.28 |
| Pivot points | S3 | S2 | S1 | PP | R1 | R2 | R3 |
|---|---|---|---|---|---|---|---|
| Standard | 5.55 | 5.67 | 5.90 | 6.03 | 6.26 | 6.38 | 6.61 |
| Camarilla | 6.03 | 6.06 | 6.10 | 6.13 | 6.16 | 6.20 | 6.23 |
| Woodie | 5.60 | 5.70 | 5.95 | 6.05 | 6.31 | 6.41 | 6.66 |
| Fibonacci | 5.67 | 5.81 | 5.89 | 6.03 | 6.16 | 6.25 | 6.38 |
Numerical data
The following are the details of the technical indicators and moving averages that were collected to generate this technical analysis:
| RSI (14): | 57.61 | |
| MACD (12,26,9): | 0.0000 | |
| Directional Movement: | 8.01 | |
| AROON (14): | -78.57 | |
| DEMA (21): | 6.11 | |
| Parabolic SAR (0,02-0,02-0,2): | 5.80 | |
| Elder Ray (13): | 0.13 | |
| Super Trend (3,10): | 6.35 | |
| Zig ZAG (10): | 6.25 | |
| VORTEX (21): | 0.9700 | |
| Stochastique (14,3,5): | 62.96 | |
| TEMA (21): | 6.02 | |
| Williams %R (14): | -6.25 | |
| Chande Momentum Oscillator (20): | 0.02 | |
| Repulse (5,40,3): | 3.2700 | |
| ROCnROLL: | 1 | |
| TRIX (15,9): | 0.0100 | |
| Courbe Coppock: | 8.35 |
| MA7: | 6.02 | |
| MA20: | 6.17 | |
| MA50: | 6.04 | |
| MA100: | 5.63 | |
| MAexp7: | 6.08 | |
| MAexp20: | 6.10 | |
| MAexp50: | 5.97 | |
| MAexp100: | 5.61 | |
| Price / MA7: | +3.82% | |
| Price / MA20: | +1.30% | |
| Price / MA50: | +3.48% | |
| Price / MA100: | +11.01% | |
| Price / MAexp7: | +2.80% | |
| Price / MAexp20: | +2.46% | |
| Price / MAexp50: | +4.69% | |
| Price / MAexp100: | +11.41% |
News
The latest news and videos published on ZYNGA INC. at the time of the analysis were as follows:
-
 Zynga Inc. - ZNGA Stock Chart Technical Analysis for 05-15-2019
-
Zynga Inc. - ZNGA Stock Chart Technical Analysis for 05-02-2019
- Zynga to Present at Upcoming Investor Conferences
-
Zynga Inc. - ZNGA Stock Chart Technical Analysis for 02-07-2019
- Zynga Announces Fourth Quarter and Full Year 2018 Financial Results
About author

Online


Add a comment
Comments
0 comments on the analysis ZYNGA INC. - Daily