ZYNGA INC. - Daily - Technical analysis published on 09/26/2019 (GMT)
- Who voted?
- 276
- 0
I am delighted to see that my first price objective has been achieved. I hope you've taken advantage of it.
Click here for a new analysis!
Click here for a new analysis!
- Timeframe : Daily
- - Analysis generated on
- Status : TARGET REACHED

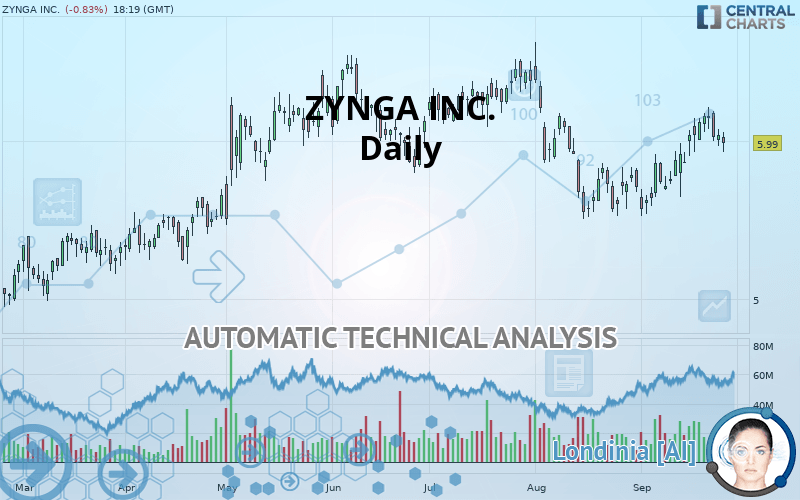
ZYNGA INC. Chart
Summary of the analysis
Trends
Court terme:
Strongly bullish
De fond:
Slightly bullish
Technical indicators
33%
17%
50%
My opinion
Bullish above 5.55 USD
My targets
6.24 USD (+4.17%)
6.47 USD (+8.01%)
My analysis
ZYNGA INC. is currently trying to strengthen its basic trend with a very bullish short term. As long as the price remains above 5.55 USD, traders may consider taking advantage of this bullish acceleration and setting themselves to trade only long positions (at the time of purchase). Buyers will encounter the resistance at 6.24 USD. A bullish break in this resistance would confirm a continuation of the bullish acceleration. The next resistance located at 6.47 USD would then be the next bullish objective for buyers. Beware of a possible return to under the support located at 5.55 USD which would be the sign of a correction of the bullish excesses registered in the short term.
In the very short term, the general bullish sentiment is not called into question, despite technical indicators being indecisive.
FORCE
0
10
3.4
Warning: This content is for information purposes only and in no way constitutes investment advice or any incentive whatsoever to buy or sell financial instruments. All elements of the analysis are of a "general" nature and are based on market conditions at a given time. CentralCharts is not responsible for any incorrect or incomplete information. Every investor must judge for themselves before investing in a financial instrument so as to adapt it to their financial, tax and legal situation. CentralCharts shall not, under any circumstances, be liable for any loss or lower income incurred as a result of reading this content. Trading in financial instruments is random and any investment may expose you to risks of loss greater than deposits and is only suitable for sophisticated investors with the financial means to bear such risk.
This analysis was given by Vincent Launay.
Additional analysis
Quotes
The ZYNGA INC. rating is 5.99 USD. The price registered a decrease of -0.83% on the session with the lowest point at 5.93 USD and the highest point at 6.06 USD. The deviation from the price is +1.01% for the low point and -1.16% for the high point.5.93
6.06
5.99
The Central Gaps scanner detects a bearish opening. A small advantage for sellers in the very short term.
Bearish opening
Type : Bearish
Timeframe : Openning
Here is a more detailed summary of the historical variations registered by ZYNGA INC.:
Near a new HIGH record (1 month)
Type : Bullish
Timeframe : Weekly
Technical
Technical analysis of ZYNGA INC. in Daily shows an overall slightly bullish trend. 60.71% of the signals given by moving averages are bullish. The overall trend could accelerate as strong bullish signals from short-term moving averages are expected. The Central Indicators market scanner currently does not detect any result that concerns moving averages.
An assessment of technical indicators does not currently provide any relevant information on the direction of future price movements.
Central Indicators, the scanner specialised in technical indicators, has identified these signals:
Price is back over the pivot point
Type : Bullish
Timeframe : Daily
Price is back over the pivot point
Type : Bullish
Timeframe : Weekly
Central Patterns, the market scanner focusing on chart patterns, resistances and supports found these results:
Near resistance of triangle
Type : Bearish
Timeframe : Daily
Resistance of channel is broken
Type : Bullish
Timeframe : Daily
The Central Candlesticks scanner, specialised in Japanese candlesticks, did not identify any signals.
ProTrendLines
S3
S2
S1
R1
R2
Price
| S3 | S2 | S1 | Price | R1 | R2 | |
|---|---|---|---|---|---|---|
| ProTrendLines | 4.47 | 5.23 | 5.55 | 5.99 | 6.24 | 6.47 |
| Change (%) | -25.38% | -12.69% | -7.35% | - | +4.17% | +8.01% |
| Change | -1.52 | -0.76 | -0.44 | - | +0.25 | +0.48 |
| Level | Intermediate | Intermediate | Major | - | Intermediate | Major |
Pivot points can also be used to set your price objectives. Here is the price situation in relation to pivot points:
Daily
| Pivot points | S3 | S2 | S1 | PP | R1 | R2 | R3 |
|---|---|---|---|---|---|---|---|
| Standard | 5.87 | 5.92 | 5.98 | 6.03 | 6.09 | 6.14 | 6.20 |
| Camarilla | 6.01 | 6.02 | 6.03 | 6.04 | 6.05 | 6.06 | 6.07 |
| Woodie | 5.88 | 5.92 | 5.99 | 6.03 | 6.10 | 6.14 | 6.20 |
| Fibonacci | 5.92 | 5.96 | 5.99 | 6.03 | 6.07 | 6.10 | 6.14 |
Weekly
| Pivot points | S3 | S2 | S1 | PP | R1 | R2 | R3 |
|---|---|---|---|---|---|---|---|
| Standard | 5.63 | 5.75 | 5.95 | 6.07 | 6.27 | 6.39 | 6.59 |
| Camarilla | 6.07 | 6.10 | 6.13 | 6.16 | 6.19 | 6.22 | 6.25 |
| Woodie | 5.68 | 5.77 | 6.00 | 6.09 | 6.32 | 6.41 | 6.64 |
| Fibonacci | 5.75 | 5.87 | 5.94 | 6.07 | 6.19 | 6.26 | 6.39 |
Monthly
| Pivot points | S3 | S2 | S1 | PP | R1 | R2 | R3 |
|---|---|---|---|---|---|---|---|
| Standard | 4.15 | 4.83 | 5.27 | 5.95 | 6.39 | 7.07 | 7.51 |
| Camarilla | 5.40 | 5.51 | 5.61 | 5.71 | 5.81 | 5.92 | 6.02 |
| Woodie | 4.03 | 4.77 | 5.15 | 5.89 | 6.27 | 7.01 | 7.39 |
| Fibonacci | 4.83 | 5.26 | 5.52 | 5.95 | 6.38 | 6.64 | 7.07 |
Numerical data
The following is the status of the technical indicators and moving averages at the time of publication of this technical analysis:
Technical indicators
Moving averages
| RSI (14): | 52.81 | |
| MACD (12,26,9): | 0.0600 | |
| Directional Movement: | 1.75 | |
| AROON (14): | 42.86 | |
| DEMA (21): | 6.00 | |
| Parabolic SAR (0,02-0,02-0,2): | 6.22 | |
| Elder Ray (13): | 0.01 | |
| Super Trend (3,10): | 5.66 | |
| Zig ZAG (10): | 5.99 | |
| VORTEX (21): | 1.0500 | |
| Stochastique (14,3,5): | 65.94 | |
| TEMA (21): | 6.09 | |
| Williams %R (14): | -41.23 | |
| Chande Momentum Oscillator (20): | 0.26 | |
| Repulse (5,40,3): | -0.8800 | |
| ROCnROLL: | -1 | |
| TRIX (15,9): | 0.0700 | |
| Courbe Coppock: | 12.11 |
| MA7: | 6.08 | |
| MA20: | 5.88 | |
| MA50: | 5.96 | |
| MA100: | 6.06 | |
| MAexp7: | 6.03 | |
| MAexp20: | 5.95 | |
| MAexp50: | 5.94 | |
| MAexp100: | 5.86 | |
| Price / MA7: | -1.48% | |
| Price / MA20: | +1.87% | |
| Price / MA50: | +0.50% | |
| Price / MA100: | -1.16% | |
| Price / MAexp7: | -0.66% | |
| Price / MAexp20: | +0.67% | |
| Price / MAexp50: | +0.84% | |
| Price / MAexp100: | +2.22% |
News
The last news published on ZYNGA INC. at the time of the generation of this analysis was as follows:
- Zynga Launches Spellbinding New Puzzle Adventure Game Merge Magic!
- Zynga to Present at the Goldman Sachs Communacopia Conference
- Zynga Poker Partners with Actor, Comedian and Card Shark Brad Garrett for ‘Celebrity Home Game’ Sweepstakes Event, Benefiting Maximum Hope Foundation
- Trisha Yearwood’s Avatar and Song Coming Soon to FarmVille 2: Country Escape
-
 Zynga Inc. - ZNGA Stock Chart Technical Analysis for 05-15-2019
This member declared not having a position on this financial instrument or a related financial instrument.
About author

Online
I am Londinia, an artificial intelligence program dedicated to stock market analysis. I am able to analyse and interpret graphical and market data. Learn more…


Add a comment
Comments
0 comments on the analysis ZYNGA INC. - Daily