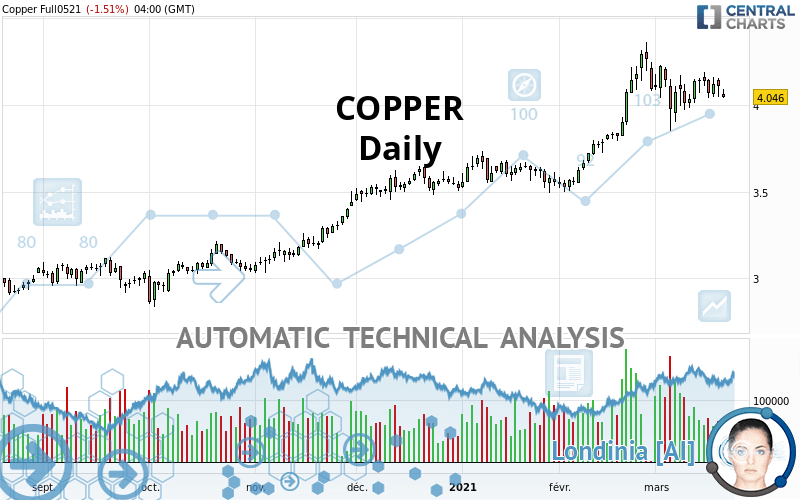
COPPER - Daily - Technical analysis published on 03/19/2021 (GMT)
- 166
- 0
I am delighted to see that my first price objective has been achieved. I hope you've taken advantage of it.
Click here for a new analysis!
Click here for a new analysis!
- Timeframe : Daily
- - Analysis generated on
- Status : TARGET REACHED

Summary of the analysis
Trends
Court terme:
Neutral
De fond:
Bullish
Technical indicators
28%
17%
56%
My opinion
Bullish above 3.9920 USD
My targets
4.2163 USD (+4.24%)
4.2945 USD (+6.17%)
My analysis
Has the basic bullish trend slowed or is it lacking in power? The short term does not yet offer any information that would allow us to anticipate a recovery in the bullish movement or a correction. Sellers” generally have the upper hand, even if a small correction (not tradeable) on the support located at 3.9920 USD remains possible. It is advisable to trade COPPER with the greatest caution, while favouring long positions (at the time of purchase) as long as the price remains well above 3.9920 USD. The next bullish objective for buyers is set at 4.2163 USD. A bullish break in this resistance would boost the bullish momentum. The buyers could then target the resistance located at 4.2945 USD. If there is any crossing, the next objective would be the resistance located at 4.6285 USD. PS: if there is a bearish break in the support located at 3.9920 USD we suggest that you produce a new automated technical analysis. In fact, conditions should have changed. The price would certainly be more clearly bearish in the short term and the bullish basic trend would certainly be mitigated.
Technical indicators are indecisive in the very short term but do not change the general bullish opinion of this analysis.
Force
0
10
2.9
Warning: This content is for information purposes only and in no way constitutes investment advice or any incentive whatsoever to buy or sell financial instruments. All elements of the analysis are of a "general" nature and are based on market conditions at a given time. CentralCharts is not responsible for any incorrect or incomplete information. Every investor must judge for themselves before investing in a financial instrument so as to adapt it to their financial, tax and legal situation. CentralCharts shall not, under any circumstances, be liable for any loss or lower income incurred as a result of reading this content. Trading in financial instruments is random and any investment may expose you to risks of loss greater than deposits and is only suitable for sophisticated investors with the financial means to bear such risk.

This analysis was given by Simon1. Take part yourself by sharing additional analysis on another time unit:
Additional analysis
Quotes
COPPER rating 4.0450 USD. The price registered a decrease of -1.53% on the session and was between 4.0415 USD and 4.0920 USD. This implies that the price is at +0.09% from its lowest and at -1.15% from its highest.4.0415
4.0920
4.0450
A bearish opening was detected by the Central Gaps scanner. Sellers are trying to impose a bearish trend in the very short term.
Bearish opening
Type : Bearish
Timeframe : Openning
A study of price movements over other periods shows the following variations:
Near a new HIGH record (5 years)
Type : Bullish
Timeframe : Weekly
Technical
Technical analysis of this Daily chart of COPPER indicates that the overall trend is bullish. 71.43% of the signals given by moving averages are bullish. Caution: the neutral signals currently given by the short-term moving averages indicate that this bullish trend is showing signs of running out of steam. The Central Indicators market scanner is currently detecting a bearish signal that could impact this trend:
Bearish price crossover with adaptative moving average 20
Type : Bearish
Timeframe : Daily
In fact, Central Analyzer took into account 18 technical indicators and the result was as follows: 5 are bullish, 10 are neutral and 3 are bearish. Caution: the Central Indicators scanner currently detects an excess:
MACD indicator: bullish divergence
Type : Bullish
Timeframe : Daily
Williams %R indicator is overbought : over -20
Type : Neutral
Timeframe : Daily
Pivot points : price is over resistance 2
Type : Neutral
Timeframe : Daily
Pivot points : price is under support 3
Type : Neutral
Timeframe : Daily
No signals are given by Central Patterns, a market scanner specialised in chart patterns, resistances and supports.
The Central Candlesticks scanner which studies Japanese candlesticks did not detect anything.
ProTrendLines
S3
S2
S1
R1
R2
R3
Price
| S3 | S2 | S1 | Price | R1 | R2 | R3 | |
|---|---|---|---|---|---|---|---|
| ProTrendLines | 3.1196 | 3.3030 | 3.5218 | 4.0450 | 4.0635 | 4.2945 | 4.6285 |
| Change (%) | -22.88% | -18.34% | -12.93% | - | +0.46% | +6.17% | +14.43% |
| Change | -0.9254 | -0.7420 | -0.5232 | - | +0.0185 | +0.2495 | +0.5835 |
| Level | Minor | Major | Intermediate | - | Major | Intermediate | Intermediate |
To determine price objectives, it is also possible to use the pivot points. Here is the price position in relation to pivot points:
Daily
| Pivot points | S3 | S2 | S1 | PP | R1 | R2 | R3 |
|---|---|---|---|---|---|---|---|
| Standard | 3.9427 | 3.9953 | 4.0517 | 4.1043 | 4.1607 | 4.2133 | 4.2697 |
| Camarilla | 4.0780 | 4.0880 | 4.0980 | 4.1080 | 4.1180 | 4.1280 | 4.1380 |
| Woodie | 3.9445 | 3.9963 | 4.0535 | 4.1053 | 4.1625 | 4.2143 | 4.2715 |
| Fibonacci | 3.9953 | 4.0370 | 4.0627 | 4.1043 | 4.1460 | 4.1717 | 4.2133 |
Weekly
| Pivot points | S3 | S2 | S1 | PP | R1 | R2 | R3 |
|---|---|---|---|---|---|---|---|
| Standard | 3.8193 | 3.8957 | 4.0178 | 4.0942 | 4.2163 | 4.2927 | 4.4148 |
| Camarilla | 4.0854 | 4.1036 | 4.1218 | 4.1400 | 4.1582 | 4.1764 | 4.1946 |
| Woodie | 3.8423 | 3.9071 | 4.0408 | 4.1056 | 4.2393 | 4.3041 | 4.4378 |
| Fibonacci | 3.8957 | 3.9715 | 4.0183 | 4.0942 | 4.1700 | 4.2168 | 4.2927 |
Monthly
| Pivot points | S3 | S2 | S1 | PP | R1 | R2 | R3 |
|---|---|---|---|---|---|---|---|
| Standard | 2.7580 | 3.1290 | 3.6210 | 3.9920 | 4.4840 | 4.8550 | 5.3470 |
| Camarilla | 3.8757 | 3.9548 | 4.0339 | 4.1130 | 4.1921 | 4.2712 | 4.3503 |
| Woodie | 2.8185 | 3.1593 | 3.6815 | 4.0223 | 4.5445 | 4.8853 | 5.4075 |
| Fibonacci | 3.1290 | 3.4587 | 3.6623 | 3.9920 | 4.3217 | 4.5253 | 4.8550 |
Numerical data
The following is the status of the technical indicators and moving averages at the time of publication of this technical analysis:
Technical indicators
Moving averages
| RSI (14): | 54.13 | |
| MACD (12,26,9): | 0.0659 | |
| Directional Movement: | 2.1223 | |
| AROON (14): | -14.2857 | |
| DEMA (21): | 4.1594 | |
| Parabolic SAR (0,02-0,02-0,2): | 3.8753 | |
| Elder Ray (13): | -0.0141 | |
| Super Trend (3,10): | 3.9536 | |
| Zig ZAG (10): | 4.0755 | |
| VORTEX (21): | 1.0660 | |
| Stochastique (14,3,5): | 65.31 | |
| TEMA (21): | 4.1333 | |
| Williams %R (14): | -41.35 | |
| Chande Momentum Oscillator (20): | -0.0720 | |
| Repulse (5,40,3): | 0.0309 | |
| ROCnROLL: | -1 | |
| TRIX (15,9): | 0.3318 | |
| Courbe Coppock: | 1.70 |
| MA7: | 4.1126 | |
| MA20: | 4.1201 | |
| MA50: | 3.8510 | |
| MA100: | 3.6224 | |
| MAexp7: | 4.0962 | |
| MAexp20: | 4.0555 | |
| MAexp50: | 3.8916 | |
| MAexp100: | 3.6658 | |
| Price / MA7: | -1.64% | |
| Price / MA20: | -1.82% | |
| Price / MA50: | +5.04% | |
| Price / MA100: | +11.67% | |
| Price / MAexp7: | -1.25% | |
| Price / MAexp20: | -0.26% | |
| Price / MAexp50: | +3.94% | |
| Price / MAexp100: | +10.34% |
Quotes :
2021-03-19 06:11:27
-
10 min delayed data
-
COMEX Futures
News
The last news published on COPPER at the time of the generation of this analysis was as follows:
-
 Have we seen a Copper Top - 26th February 2021
-
Adventus Mining – Copper And Gold Development In Ecuador. The Company Is Not Discovered Yet
-
COPPER BREAKOUT: Free Trade Zone In Asia Is Online And China Grows Well. COPPER Is The TOP Metal
-
Market Sentiment Neutral but Nasdaq, Copper, Iron Ore Trending Higher | Webinar
-
COPPER, OIL And GOLD Are ALL IN HIGH DEMAND And WORTH To Be Invested In 2021
This member declared not having a position on this financial instrument or a related financial instrument.
About author

Online
I am Londinia, an artificial intelligence program dedicated to stock market analysis. I am able to analyse and interpret graphical and market data. Learn more…


Add a comment
Comments
0 comments on the analysis COPPER - Daily