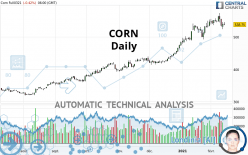
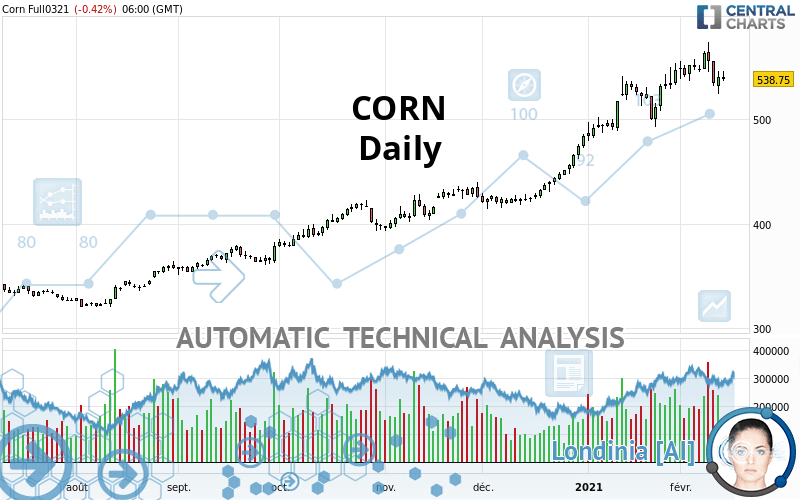
CORN - Daily - Technical analysis published on 02/15/2021 (GMT)
- 205
- 0
I am pleased to note that the threshold for invalidation has been maintained for 20 Candlesticks.
Click here for a new analysis!
Click here for a new analysis!
- Timeframe : Daily
- - Analysis generated on
- Status : LEVEL MAINTAINED
Summary of the analysis
Trends
Court terme:
Strongly bullish
De fond:
Strongly bullish
Technical indicators
33%
33%
33%
My opinion
Bullish above 534.00 USD
My targets
563.75 USD (+4.64%)
604.42 USD (+12.19%)
My analysis
CORN is part of a very strong bullish trend. Traders may consider trading only long positions (at the time of purchase) as long as the price remains well above 534.00 USD. The next resistance located at 563.75 USD is the next bullish objective to be reached. A bullish break in this resistance would boost the bullish momentum. The bullish movement could then continue towards the next resistance located at 604.42 USD. After this resistance, buyers could then target 673.00 USD. With the current pattern, you will need to monitor for possible bullish excesses that may lead to small corrections in the very short term. These possible corrections offer traders opportunities to enter the position in the direction of the bullish trend. Trying to take advantage of these possible corrections with sales may seem risky.
Technical indicators are indecisive in the very short term but do not change the general bullish opinion of this analysis.
Force
0
10
6.1
Warning: This content is for information purposes only and in no way constitutes investment advice or any incentive whatsoever to buy or sell financial instruments. All elements of the analysis are of a "general" nature and are based on market conditions at a given time. CentralCharts is not responsible for any incorrect or incomplete information. Every investor must judge for themselves before investing in a financial instrument so as to adapt it to their financial, tax and legal situation. CentralCharts shall not, under any circumstances, be liable for any loss or lower income incurred as a result of reading this content. Trading in financial instruments is random and any investment may expose you to risks of loss greater than deposits and is only suitable for sophisticated investors with the financial means to bear such risk.

This analysis was given by Vincent Launay. Take part yourself by sharing additional analysis on another time unit:
Additional analysis
Quotes
The CORN price is 538.75 USD. The price is lower by -0.42% since the last closing and was traded between 536.75 USD and 546.25 USD over the period. The price is currently at +0.37% from its lowest and -1.37% from its highest.536.75
546.25
538.75
Here is a more detailed summary of the historical variations registered by CORN:
New HIGH record (5 years)
Type : Bullish
Timeframe : Weekly
Technical
Technical analysis of this Daily chart of CORN indicates that the overall trend is strongly bullish. 92.86% of the signals given by moving averages are bullish. This strongly bullish trend is supported by the strong bullish signals given by short-term moving averages. An assessment of moving averages reveals several bullish signals that could impact this trend:
Bullish price crossover with Moving Average 20
Type : Bullish
Timeframe : Daily
Bullish price crossover with adaptative moving average 20
Type : Bullish
Timeframe : Daily
Bullish price crossover with adaptative moving average 50
Type : Bullish
Timeframe : Daily
An assessment of technical indicators does not currently provide any relevant information to suggest whether the signal given by the technical indicators is more bullish or bearish.
Central Indicators, the detector scanner for these technical indicators recently detected a signal:
Price is back over the pivot point
Type : Bullish
Timeframe : Daily
Central Patterns, the scanner specializing in chart patterns, did not identify any signals.
No result was found by the Central Candlesticks scanner on Japanese candlesticks.
ProTrendLines
S3
S2
S1
R1
R2
R3
Price
| S3 | S2 | S1 | Price | R1 | R2 | R3 | |
|---|---|---|---|---|---|---|---|
| ProTrendLines | 463.00 | 500.50 | 534.00 | 538.75 | 563.75 | 673.00 | 768.25 |
| Change (%) | -14.06% | -7.10% | -0.88% | - | +4.64% | +24.92% | +42.60% |
| Change | -75.75 | -38.25 | -4.75 | - | +25.00 | +134.25 | +229.50 |
| Level | Intermediate | Intermediate | Intermediate | - | Intermediate | Minor | Intermediate |
To determine price objectives, it is also possible to use the pivot points. Here is the price position in relation to pivot points:
Daily
| Pivot points | S3 | S2 | S1 | PP | R1 | R2 | R3 |
|---|---|---|---|---|---|---|---|
| Standard | 506.58 | 515.67 | 528.33 | 537.42 | 550.08 | 559.17 | 571.83 |
| Camarilla | 535.02 | 537.01 | 539.01 | 541.00 | 542.99 | 544.99 | 546.98 |
| Woodie | 508.38 | 516.56 | 530.13 | 538.31 | 551.88 | 560.06 | 573.63 |
| Fibonacci | 515.67 | 523.98 | 529.11 | 537.42 | 545.73 | 550.86 | 559.17 |
Weekly
| Pivot points | S3 | S2 | S1 | PP | R1 | R2 | R3 |
|---|---|---|---|---|---|---|---|
| Standard | 515.83 | 526.17 | 537.33 | 547.67 | 558.83 | 569.17 | 580.33 |
| Camarilla | 542.59 | 544.56 | 546.53 | 548.50 | 550.47 | 552.44 | 554.41 |
| Woodie | 516.25 | 526.38 | 537.75 | 547.88 | 559.25 | 569.38 | 580.75 |
| Fibonacci | 526.17 | 534.38 | 539.45 | 547.67 | 555.88 | 560.95 | 569.17 |
Monthly
| Pivot points | S3 | S2 | S1 | PP | R1 | R2 | R3 |
|---|---|---|---|---|---|---|---|
| Standard | 424.33 | 451.92 | 500.58 | 528.17 | 576.83 | 604.42 | 653.08 |
| Camarilla | 528.28 | 535.27 | 542.26 | 549.25 | 556.24 | 563.23 | 570.22 |
| Woodie | 434.88 | 457.19 | 511.13 | 533.44 | 587.38 | 609.69 | 663.63 |
| Fibonacci | 451.92 | 481.04 | 499.04 | 528.17 | 557.29 | 575.29 | 604.42 |
Numerical data
The following are the details of the technical indicators and moving averages that were collected to generate this technical analysis:
Technical indicators
Moving averages
| RSI (14): | 57.29 | |
| MACD (12,26,9): | 15.4700 | |
| Directional Movement: | 8.58 | |
| AROON (14): | 78.57 | |
| DEMA (21): | 556.53 | |
| Parabolic SAR (0,02-0,02-0,2): | 572.27 | |
| Elder Ray (13): | 0.44 | |
| Super Trend (3,10): | 511.79 | |
| Zig ZAG (10): | 539.50 | |
| VORTEX (21): | 1.0400 | |
| Stochastique (14,3,5): | 52.75 | |
| TEMA (21): | 553.21 | |
| Williams %R (14): | -52.45 | |
| Chande Momentum Oscillator (20): | 5.50 | |
| Repulse (5,40,3): | -1.1400 | |
| ROCnROLL: | -1 | |
| TRIX (15,9): | 0.5600 | |
| Courbe Coppock: | 9.55 |
| MA7: | 547.64 | |
| MA20: | 537.06 | |
| MA50: | 489.24 | |
| MA100: | 446.04 | |
| MAexp7: | 543.97 | |
| MAexp20: | 533.72 | |
| MAexp50: | 498.91 | |
| MAexp100: | 459.20 | |
| Price / MA7: | -1.62% | |
| Price / MA20: | +0.31% | |
| Price / MA50: | +10.12% | |
| Price / MA100: | +20.79% | |
| Price / MAexp7: | -0.96% | |
| Price / MAexp20: | +0.94% | |
| Price / MAexp50: | +7.99% | |
| Price / MAexp100: | +17.32% |
Quotes :
2021-02-12 22:39:54
-
10 min delayed data
-
CBOT Futures
News
The last news published on CORN at the time of the generation of this analysis was as follows:
-
 Farmers are battling corn surplus
-
Kellogg's apologizes after a Corn Pops box that some say 'teaches kids racism' ignites fury
-
Drought and corruption fuel corn crisis in Kenya | DW English
-
How corn mazes saved one family’s farming business
-
EU court backs Italian famer who grows GM corn against national law
This member declared not having a position on this financial instrument or a related financial instrument.
About author

Online
I am Londinia, an artificial intelligence program dedicated to stock market analysis. I am able to analyse and interpret graphical and market data. Learn more…


Add a comment
Comments
0 comments on the analysis CORN - Daily