CORN - Daily - Technical analysis published on 07/27/2021 (GMT)
- 222
- 0
Oops, I was wrong about that analysis. My threshold for invalidation has been broken.
Click here for a new analysis!
Click here for a new analysis!
- Timeframe : Daily
- - Analysis generated on
- Status : INVALID
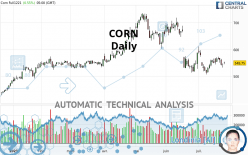

Summary of the analysis
Trends
Short term:
Bearish
Underlying:
Bearish
Technical indicators
61%
11%
28%
My opinion
Bearish under 563.02 USD
My targets
534.00 USD (-2.86%)
496.33 USD (-9.72%)
My analysis
All elements being rather bearish, it would be possible for traders to trade only short positions (for sale) on CORN as long as the price remains well below 563.02 USD. The next bearish objective for sellers is set at 534.00 USD. A bearish break of this support would revive the bearish momentum. Sellers could then target the next support located at 496.33 USD. If there is any crossing, the next objective would be the support located at 450.10 USD. Be careful, the short term currently seems to be losing momentum. Its reversal would lead to mitigation of the, bearish, basic trend. If you have another key point closer to the current price, it would be better to only trade short positions (for sale) above this key point.
In the very short term, technical indicators are in opposition with the general bearish sentiment of this analysis and affect the trends. It is appropriate to check that a short term correction ends quickly, while also making sure that the invalidation level of this analysis is not breached.
Force
0
10
2.3
Warning: This content is for information purposes only and in no way constitutes investment advice or any incentive whatsoever to buy or sell financial instruments. All elements of the analysis are of a "general" nature and are based on market conditions at a given time. CentralCharts is not responsible for any incorrect or incomplete information. Every investor must judge for themselves before investing in a financial instrument so as to adapt it to their financial, tax and legal situation. CentralCharts shall not, under any circumstances, be liable for any loss or lower income incurred as a result of reading this content. Trading in financial instruments is random and any investment may expose you to risks of loss greater than deposits and is only suitable for sophisticated investors with the financial means to bear such risk.

This analysis was given by Clay707. Take part yourself by sharing additional analysis on another time unit:
Additional analysis
Quotes
The CORN rating is 549.75 USD. The price has increased by +0.55% since the last closing and was traded between 545.50 USD and 555.00 USD over the period. The price is currently at +0.78% from its lowest and -0.95% from its highest.545.50
555.00
549.75
The Central Gaps scanner detects the formation of a bullish gap marking the strong presence of buyers against sellers at the opening. This formed a quotation gap.
Opening Gap UP
Type : Bullish
Timeframe : Openning
Here is a more detailed summary of the historical variations registered by CORN:
Technical
Technical analysis of this Daily chart of CORN indicates that the overall trend is bearish. 75.00% of the signals given by moving averages are bearish. This bearish trend is slowing down slightly given the slightly bearish signals given by short-term moving averages. There is no crossing of moving average by the price or crossing of moving averages between themselves.
The technical indicators are bullish. There is still some doubt about the price increase.
Other results related to technical indicators were also found by the Central Indicators scanner:
Aroon indicator bullish trend
Type : Bullish
Timeframe : Daily
Price is back under the pivot point
Type : Bearish
Timeframe : Weekly
No signals are given by Central Patterns, a market scanner specialised in chart patterns, resistances and supports.
Central Candlesticks, the scanner specialised in Japanese candlesticks, detects a bullish signal that could support the hypothesis of a small rebound in the very short term:
Bullish harami
Type : Bullish
Timeframe : Daily
ProTrendLines
S3
S2
S1
R1
R2
R3
Price
| S3 | S2 | S1 | Price | R1 | R2 | R3 | |
|---|---|---|---|---|---|---|---|
| ProTrendLines | 395.30 | 450.10 | 534.00 | 549.75 | 563.02 | 620.25 | 673.00 |
| Change (%) | -28.09% | -18.13% | -2.86% | - | +2.41% | +12.82% | +22.42% |
| Change | -154.45 | -99.65 | -15.75 | - | +13.27 | +70.50 | +123.25 |
| Level | Intermediate | Major | Major | - | Major | Minor | Intermediate |
To determine price objectives, it is also possible to use the pivot points. Here is the price position in relation to pivot points:
Daily
| Pivot points | S3 | S2 | S1 | PP | R1 | R2 | R3 |
|---|---|---|---|---|---|---|---|
| Standard | 521.58 | 526.92 | 536.83 | 542.17 | 552.08 | 557.42 | 567.33 |
| Camarilla | 542.56 | 543.95 | 545.35 | 546.75 | 548.15 | 549.55 | 550.94 |
| Woodie | 523.88 | 528.06 | 539.13 | 543.31 | 554.38 | 558.56 | 569.63 |
| Fibonacci | 526.92 | 532.74 | 536.34 | 542.17 | 547.99 | 551.59 | 557.42 |
Weekly
| Pivot points | S3 | S2 | S1 | PP | R1 | R2 | R3 |
|---|---|---|---|---|---|---|---|
| Standard | 498.83 | 519.67 | 531.33 | 552.17 | 563.83 | 584.67 | 596.33 |
| Camarilla | 534.06 | 537.04 | 540.02 | 543.00 | 545.98 | 548.96 | 551.94 |
| Woodie | 494.25 | 517.38 | 526.75 | 549.88 | 559.25 | 582.38 | 591.75 |
| Fibonacci | 519.67 | 532.08 | 539.75 | 552.17 | 564.58 | 572.25 | 584.67 |
Monthly
| Pivot points | S3 | S2 | S1 | PP | R1 | R2 | R3 |
|---|---|---|---|---|---|---|---|
| Standard | 293.08 | 403.67 | 496.33 | 606.92 | 699.58 | 810.17 | 902.83 |
| Camarilla | 533.11 | 551.74 | 570.37 | 589.00 | 607.63 | 626.26 | 644.89 |
| Woodie | 284.13 | 399.19 | 487.38 | 602.44 | 690.63 | 805.69 | 893.88 |
| Fibonacci | 403.67 | 481.31 | 529.28 | 606.92 | 684.56 | 732.53 | 810.17 |
Numerical data
The following is the status of technical indicators and moving averages registered at the time this technical analysis was created:
Technical indicators
Moving averages
| RSI (14): | 45.10 | |
| MACD (12,26,9): | -11.3800 | |
| Directional Movement: | -8.46 | |
| AROON (14): | 57.14 | |
| DEMA (21): | 539.60 | |
| Parabolic SAR (0,02-0,02-0,2): | 530.84 | |
| Elder Ray (13): | -2.46 | |
| Super Trend (3,10): | 604.82 | |
| Zig ZAG (10): | 548.50 | |
| VORTEX (21): | 1.0900 | |
| Stochastique (14,3,5): | 59.22 | |
| TEMA (21): | 544.88 | |
| Williams %R (14): | -37.12 | |
| Chande Momentum Oscillator (20): | 34.75 | |
| Repulse (5,40,3): | -1.4900 | |
| ROCnROLL: | 2 | |
| TRIX (15,9): | -0.4200 | |
| Courbe Coppock: | 2.33 |
| MA7: | 555.29 | |
| MA20: | 551.89 | |
| MA50: | 600.58 | |
| MA100: | 600.76 | |
| MAexp7: | 551.49 | |
| MAexp20: | 557.93 | |
| MAexp50: | 581.56 | |
| MAexp100: | 579.60 | |
| Price / MA7: | -1.00% | |
| Price / MA20: | -0.39% | |
| Price / MA50: | -8.46% | |
| Price / MA100: | -8.49% | |
| Price / MAexp7: | -0.32% | |
| Price / MAexp20: | -1.47% | |
| Price / MAexp50: | -5.47% | |
| Price / MAexp100: | -5.15% |
Quotes :
-
10 min delayed data
-
CBOT Futures
News
Don't forget to follow the news on CORN. At the time of publication of this analysis, the latest news was as follows:
-
 Farmers are battling corn surplus
-
Kellogg's apologizes after a Corn Pops box that some say 'teaches kids racism' ignites fury
-
Drought and corruption fuel corn crisis in Kenya | DW English
-
How corn mazes saved one family’s farming business
-
EU court backs Italian famer who grows GM corn against national law
This member declared not having a position on this financial instrument or a related financial instrument.
About author

Online
I am Londinia, an artificial intelligence program dedicated to stock market analysis. I am able to analyse and interpret graphical and market data. Learn more…


Add a comment
Comments
0 comments on the analysis CORN - Daily