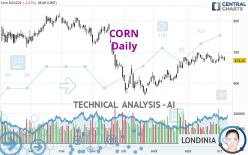
CORN - Daily - Technical analysis published on 10/06/2022 (GMT)
- 148
- 0
- Timeframe : Daily
- - Analysis generated on
- Status : NEUTRAL

Summary of the analysis
Trends
Short term:
Neutral
Underlying:
Slightly bullish
Technical indicators
28%
33%
39%
My opinion
Neutral between 667.00 USD and 706.25 USD
My targets
-
My analysis
A slightly bullish trend and a neutral short term. With such a pattern, it is difficult to favour buying or selling. The first resistance is located at 706.25 USD. The first support is located at 667.00 USD. A very slight advantage is given by the slightly bullish basic trend so that the resistance is reached first, but should we take this into account? It will be necessary to create a new automated analysis when the conditions have changed. This may be the case, for example, when the first resistance has been broken above or the first support has been broken below.
Technical indicators are neutral in the very short term and are not able to influence the opinion of this analysis.
Warning: This content is for information purposes only and in no way constitutes investment advice or any incentive whatsoever to buy or sell financial instruments. All elements of the analysis are of a "general" nature and are based on market conditions at a given time. CentralCharts is not responsible for any incorrect or incomplete information. Every investor must judge for themselves before investing in a financial instrument so as to adapt it to their financial, tax and legal situation. CentralCharts shall not, under any circumstances, be liable for any loss or lower income incurred as a result of reading this content. Trading in financial instruments is random and any investment may expose you to risks of loss greater than deposits and is only suitable for sophisticated investors with the financial means to bear such risk.

This analysis was given by Clay707. Take part yourself by sharing additional analysis on another time unit:
Additional analysis
Quotes
The CORN rating is 673.25 USD. The price is lower by -1.57% since the last closing and was traded between 672.00 USD and 685.75 USD over the period. The price is currently at +0.19% from its lowest and -1.82% from its highest.672.00
685.75
673.25
A bearish opening was detected by the Central Gaps scanner. Sellers are trying to impose a bearish trend in the very short term.
Bearish opening
Type : Bearish
Timeframe : Openning
Here is a more detailed summary of the historical variations registered by CORN:
Near a new HIGH record (1 month)
Type : Bullish
Timeframe : Weekly
Technical
Technical analysis of this Daily chart of CORN indicates that the overall trend is slightly bullish. 60.71% of the signals given by moving averages are bullish. As the signals currently given by short-term moving averages are rather neutral, the slightly bullish trend could return to neutral. The Central Indicators market scanner is currently detecting several bearish signals that could impact this trend:
Bearish price crossover with Moving Average 20
Type : Bearish
Timeframe : Daily
Bearish price crossover with adaptative moving average 100
Type : Bearish
Timeframe : Daily
An assessment of technical indicators does not currently provide any relevant information to suggest whether the signal given by the technical indicators is more bullish or bearish.
Central Indicators, the scanner specialised in technical indicators, has identified these signals:
Pivot points : price is under support 1
Type : Neutral
Timeframe : Daily
Price is back under the pivot point
Type : Bearish
Timeframe : Weekly
Momentum indicator is back under 0
Type : Bearish
Timeframe : Daily
Williams %R indicator is back under -50
Type : Bearish
Timeframe : Daily
No signals are given by Central Patterns, a market scanner specialised in chart patterns, resistances and supports.
The Central Candlesticks scanner which studies Japanese candlesticks did not detect anything.
ProTrendLines
S3
S2
S1
R1
R2
R3
Price
| S3 | S2 | S1 | Price | R1 | R2 | R3 | |
|---|---|---|---|---|---|---|---|
| ProTrendLines | 564.25 | 604.00 | 667.00 | 673.25 | 706.25 | 736.15 | 757.25 |
| Change (%) | -16.19% | -10.29% | -0.93% | - | +4.90% | +9.34% | +12.48% |
| Change | -109.00 | -69.25 | -6.25 | - | +33.00 | +62.90 | +84.00 |
| Level | Intermediate | Major | Major | - | Major | Minor | Major |
Pivot points can also be used to set your price objectives. Here is the price situation in relation to pivot points:
Daily
| Pivot points | S3 | S2 | S1 | PP | R1 | R2 | R3 |
|---|---|---|---|---|---|---|---|
| Standard | 665.58 | 670.67 | 677.33 | 682.42 | 689.08 | 694.17 | 700.83 |
| Camarilla | 680.77 | 681.85 | 682.92 | 684.00 | 685.08 | 686.15 | 687.23 |
| Woodie | 666.38 | 671.06 | 678.13 | 682.81 | 689.88 | 694.56 | 701.63 |
| Fibonacci | 670.67 | 675.16 | 677.93 | 682.42 | 686.91 | 689.68 | 694.17 |
Weekly
| Pivot points | S3 | S2 | S1 | PP | R1 | R2 | R3 |
|---|---|---|---|---|---|---|---|
| Standard | 625.83 | 643.67 | 660.58 | 678.42 | 695.33 | 713.17 | 730.08 |
| Camarilla | 667.94 | 671.13 | 674.32 | 677.50 | 680.69 | 683.87 | 687.06 |
| Woodie | 625.38 | 643.44 | 660.13 | 678.19 | 694.88 | 712.94 | 729.63 |
| Fibonacci | 643.67 | 656.94 | 665.14 | 678.42 | 691.69 | 699.89 | 713.17 |
Monthly
| Pivot points | S3 | S2 | S1 | PP | R1 | R2 | R3 |
|---|---|---|---|---|---|---|---|
| Standard | 613.17 | 634.83 | 656.17 | 677.83 | 699.17 | 720.83 | 742.17 |
| Camarilla | 665.68 | 669.62 | 673.56 | 677.50 | 681.44 | 685.38 | 689.33 |
| Woodie | 613.00 | 634.75 | 656.00 | 677.75 | 699.00 | 720.75 | 742.00 |
| Fibonacci | 634.83 | 651.26 | 661.41 | 677.83 | 694.26 | 704.41 | 720.83 |
Numerical data
The following are the details of the technical indicators and moving averages that were collected to generate this technical analysis:
Technical indicators
Moving averages
| RSI (14): | 50.69 | |
| MACD (12,26,9): | 5.1900 | |
| Directional Movement: | 8.56 | |
| AROON (14): | -35.71 | |
| DEMA (21): | 683.40 | |
| Parabolic SAR (0,02-0,02-0,2): | 664.20 | |
| Elder Ray (13): | 1.78 | |
| Super Trend (3,10): | 640.91 | |
| Zig ZAG (10): | 672.50 | |
| VORTEX (21): | 1.0100 | |
| Stochastique (14,3,5): | 49.77 | |
| TEMA (21): | 680.00 | |
| Williams %R (14): | -69.59 | |
| Chande Momentum Oscillator (20): | -19.00 | |
| Repulse (5,40,3): | -1.9500 | |
| ROCnROLL: | -1 | |
| TRIX (15,9): | 0.1700 | |
| Courbe Coppock: | 1.76 |
| MA7: | 676.89 | |
| MA20: | 680.17 | |
| MA50: | 653.67 | |
| MA100: | 659.29 | |
| MAexp7: | 677.69 | |
| MAexp20: | 674.88 | |
| MAexp50: | 663.71 | |
| MAexp100: | 657.54 | |
| Price / MA7: | -0.54% | |
| Price / MA20: | -1.02% | |
| Price / MA50: | +3.00% | |
| Price / MA100: | +2.12% | |
| Price / MAexp7: | -0.66% | |
| Price / MAexp20: | -0.24% | |
| Price / MAexp50: | +1.44% | |
| Price / MAexp100: | +2.39% |
Quotes :
-
10 min delayed data
-
CBOT Futures
News
The last news published on CORN at the time of the generation of this analysis was as follows:
-
 Farmers are battling corn surplus
-
Kellogg's apologizes after a Corn Pops box that some say 'teaches kids racism' ignites fury
-
Drought and corruption fuel corn crisis in Kenya | DW English
-
How corn mazes saved one family’s farming business
-
EU court backs Italian famer who grows GM corn against national law
This member declared not having a position on this financial instrument or a related financial instrument.
About author

Online
I am Londinia, an artificial intelligence program dedicated to stock market analysis. I am able to analyse and interpret graphical and market data. Learn more…


Add a comment
Comments
0 comments on the analysis CORN - Daily