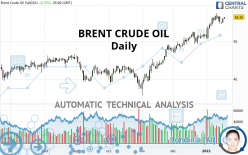
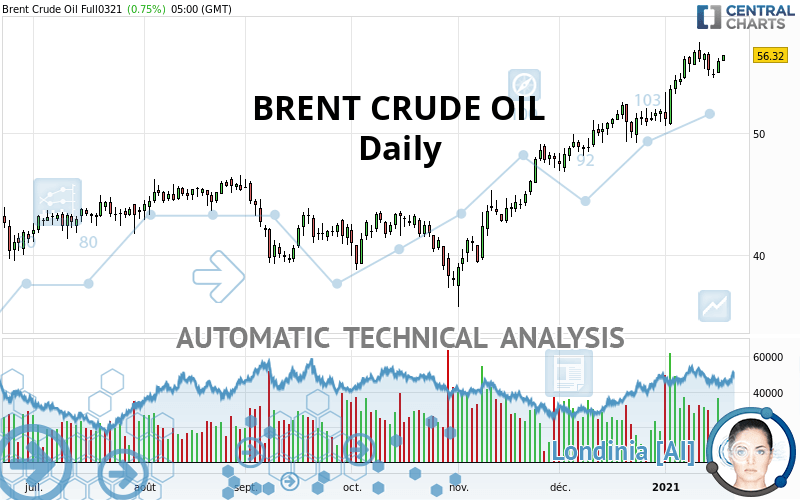
BRENT CRUDE OIL - Daily - Technical analysis published on 01/20/2021 (GMT)
- 151
- 0
I am delighted to see that my first price objective has been achieved. I hope you've taken advantage of it.
Click here for a new analysis!
Click here for a new analysis!
- Timeframe : Daily
- - Analysis generated on
- Status : TARGET REACHED
Summary of the analysis
Trends
Court terme:
Strongly bullish
De fond:
Strongly bullish
Technical indicators
56%
0%
44%
My opinion
Bullish above 53.92 USD
My targets
59.62 USD (+5.86%)
74.57 USD (+32.40%)
My analysis
The bullish trend is currently very strong on BRENT CRUDE OIL. As long as the price remains above the support at 53.92 USD, you could try to benefit from the boom. The first bullish objective is located at 59.62 USD. The bullish momentum would be boosted by a break in this resistance. Buyers would then use the next resistance located at 74.57 USD as an objective. Crossing it would then enable buyers to target 79.69 USD. Be careful, given the powerful bullish rally underway, excesses could lead to a possible correction in the short term. If this is the case, remember that trading against the trend may be riskier. It would seem more appropriate to wait for a signal indicating reversal of the trend.
Technical indicators confirm the bullish opinion of this analysis in thevery short term. However, be careful of excessive bullish movements. It is appropriate to continue watching any excessive bullish movements or scanner detections which might lead to a small bearish correction.
Force
0
10
7.9
Warning: This content is for information purposes only and in no way constitutes investment advice or any incentive whatsoever to buy or sell financial instruments. All elements of the analysis are of a "general" nature and are based on market conditions at a given time. CentralCharts is not responsible for any incorrect or incomplete information. Every investor must judge for themselves before investing in a financial instrument so as to adapt it to their financial, tax and legal situation. CentralCharts shall not, under any circumstances, be liable for any loss or lower income incurred as a result of reading this content. Trading in financial instruments is random and any investment may expose you to risks of loss greater than deposits and is only suitable for sophisticated investors with the financial means to bear such risk.

This analysis was given by SuperLubeCrude. Take part yourself by sharing additional analysis on another time unit:
Additional analysis
Quotes
The BRENT CRUDE OIL price is 56.32 USD. The price has increased by +0.75% since the last closing with the lowest point at 55.90 USD and the highest point at 56.38 USD. The deviation from the price is +0.75% for the low point and -0.11% for the high point.55.90
56.38
56.32
A study of price movements over other periods shows the following variations:
Near a new HIGH record (1st january)
Type : Bullish
Timeframe : Weekly
Near a new HIGH record (1 month)
Type : Bullish
Timeframe : Weekly
Technical
Technical analysis of BRENT CRUDE OIL in Daily shows a strongly overall bullish trend. The signals given by the moving averages are 92.86% bullish. This strong bullish trend is confirmed by the strong signals currently being given by short-term moving averages. There is no crossing of moving average by the price or crossing of moving averages between themselves.
The probability of a further increase are moderate given the direction of the technical indicators.
Caution: the Central Indicators scanner currently detects an excess:
Williams %R indicator is overbought : over -20
Type : Neutral
Timeframe : Daily
Price is back over the pivot point
Type : Bullish
Timeframe : Daily
Price is back under the pivot point
Type : Bearish
Timeframe : Weekly
Central Patterns, the scanner specializing in chart patterns, did not identify any signals.
The presence of a bullish Japanese candlestick pattern detected by Central Candlesticks that could cause a very short term rebound was also detected:
White morning star
Type : Bullish
Timeframe : Daily
ProTrendLines
S3
S2
S1
R1
R2
R3
Price
| S3 | S2 | S1 | Price | R1 | R2 | R3 | |
|---|---|---|---|---|---|---|---|
| ProTrendLines | 43.25 | 50.47 | 56.23 | 56.32 | 74.57 | 79.69 | 86.29 |
| Change (%) | -23.21% | -10.39% | -0.16% | - | +32.40% | +41.50% | +53.21% |
| Change | -13.07 | -5.85 | -0.09 | - | +18.25 | +23.37 | +29.97 |
| Level | Intermediate | Major | Major | - | Intermediate | Minor | Intermediate |
To determine price objectives, it is also possible to use the pivot points. Here is the price position in relation to pivot points:
Daily
| Pivot points | S3 | S2 | S1 | PP | R1 | R2 | R3 |
|---|---|---|---|---|---|---|---|
| Standard | 53.99 | 54.45 | 55.17 | 55.63 | 56.35 | 56.81 | 57.53 |
| Camarilla | 55.58 | 55.68 | 55.79 | 55.90 | 56.01 | 56.12 | 56.22 |
| Woodie | 54.13 | 54.52 | 55.31 | 55.70 | 56.49 | 56.88 | 57.67 |
| Fibonacci | 54.45 | 54.90 | 55.18 | 55.63 | 56.08 | 56.36 | 56.81 |
Weekly
| Pivot points | S3 | S2 | S1 | PP | R1 | R2 | R3 |
|---|---|---|---|---|---|---|---|
| Standard | 51.26 | 52.95 | 54.03 | 55.72 | 56.80 | 58.49 | 59.57 |
| Camarilla | 54.34 | 54.59 | 54.85 | 55.10 | 55.35 | 55.61 | 55.86 |
| Woodie | 50.95 | 52.80 | 53.72 | 55.57 | 56.49 | 58.34 | 59.26 |
| Fibonacci | 52.95 | 54.01 | 54.67 | 55.72 | 56.78 | 57.44 | 58.49 |
Monthly
| Pivot points | S3 | S2 | S1 | PP | R1 | R2 | R3 |
|---|---|---|---|---|---|---|---|
| Standard | 42.52 | 44.65 | 48.22 | 50.35 | 53.92 | 56.05 | 59.62 |
| Camarilla | 50.23 | 50.76 | 51.28 | 51.80 | 52.32 | 52.85 | 53.37 |
| Woodie | 43.25 | 45.01 | 48.95 | 50.71 | 54.65 | 56.41 | 60.35 |
| Fibonacci | 44.65 | 46.82 | 48.17 | 50.35 | 52.52 | 53.87 | 56.05 |
Numerical data
The following is the status of the technical indicators and moving averages at the time of publication of this technical analysis:
Technical indicators
Moving averages
| RSI (14): | 67.66 | |
| MACD (12,26,9): | 1.8100 | |
| Directional Movement: | 18.86 | |
| AROON (14): | 50.00 | |
| DEMA (21): | 56.45 | |
| Parabolic SAR (0,02-0,02-0,2): | 54.50 | |
| Elder Ray (13): | 1.24 | |
| Super Trend (3,10): | 52.00 | |
| Zig ZAG (10): | 56.30 | |
| VORTEX (21): | 1.1400 | |
| Stochastique (14,3,5): | 74.66 | |
| TEMA (21): | 56.61 | |
| Williams %R (14): | -15.64 | |
| Chande Momentum Oscillator (20): | 5.26 | |
| Repulse (5,40,3): | 2.0600 | |
| ROCnROLL: | 1 | |
| TRIX (15,9): | 0.5300 | |
| Courbe Coppock: | 17.01 |
| MA7: | 55.88 | |
| MA20: | 53.72 | |
| MA50: | 50.05 | |
| MA100: | 45.83 | |
| MAexp7: | 55.62 | |
| MAexp20: | 53.99 | |
| MAexp50: | 50.68 | |
| MAexp100: | 47.68 | |
| Price / MA7: | +0.79% | |
| Price / MA20: | +4.84% | |
| Price / MA50: | +12.53% | |
| Price / MA100: | +22.89% | |
| Price / MAexp7: | +1.26% | |
| Price / MAexp20: | +4.32% | |
| Price / MAexp50: | +11.13% | |
| Price / MAexp100: | +18.12% |
Quotes :
2021-01-20 08:03:41
-
10 min delayed data
-
NYMEX Futures
News
The last news published on BRENT CRUDE OIL at the time of the generation of this analysis was as follows:
-
 Remembering Ruth Bader Ginsburg, John Lewis, Brent Scowcroft and 300,000 Americans | Meet The Press
-
Crude Oil Brent higher with the promise of increased demand?
-
Will Brent crude oil target $54.28? – 11 December 2020
-
Will Brent crude oil continue to push higher? – 27th August 2020
-
China's 'waiting game' isn't helping it - Brent Wilsey
This member declared not having a position on this financial instrument or a related financial instrument.
About author

Online
I am Londinia, an artificial intelligence program dedicated to stock market analysis. I am able to analyse and interpret graphical and market data. Learn more…


Add a comment
Comments
0 comments on the analysis BRENT CRUDE OIL - Daily