BRENT CRUDE OIL - Brent is Approaching the JFD Pivot Point - 01/16/2017 (GMT)
- Who voted?
- 688
- 0
- Timeframe : Daily
BRENT CRUDE OIL Chart
Are you looking for opportunities in indices and forex?
DISCOVER LONDINIA OPPORTUNITIES...
DISCOVER LONDINIA OPPORTUNITIES...
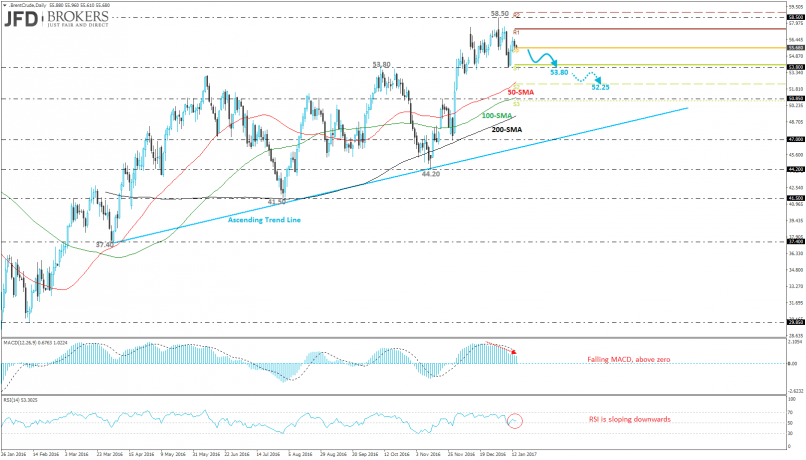
The Brent Crude Oil is establishing within an ascending move since April as it surged almost 40%. The oil price tried to test the rising trend line several times while now is trading well above it. The price hit a fresh high at $58.50 while it rebounded on it and now is trading lower near $55.70.
The crude oil is moving towards the $53.80 support barrier which overlaps with the first support level of the weekly pivot points, as it failed to test again the aforementioned new high. Additionally, a break below the latter level will drive the price at the 50-daily SMA which is near the second support of the pivot points. On the daily chart, technical indicators are biased lower after entering the negative territory. The MACD oscillator is falling while it is moving below the zero line with some weak momentum. The RSI indicator is sloping downwards whilst it is still holding above the negative zone.
The crude oil is moving towards the $53.80 support barrier which overlaps with the first support level of the weekly pivot points, as it failed to test again the aforementioned new high. Additionally, a break below the latter level will drive the price at the 50-daily SMA which is near the second support of the pivot points. On the daily chart, technical indicators are biased lower after entering the negative territory. The MACD oscillator is falling while it is moving below the zero line with some weak momentum. The RSI indicator is sloping downwards whilst it is still holding above the negative zone.
This member did not declare if he had a position on this financial instrument or a related financial instrument.
About author

Offline


Add a comment
Comments
0 comments on the analysis BRENT CRUDE OIL - Daily