BRENT CRUDE OIL - is Developing Sideways - 01/27/2017 (GMT)
- Who voted?
- 472
- 0
- Timeframe : Daily
BRENT CRUDE OIL Chart
Are you looking for opportunities in indices and forex?
DISCOVER LONDINIA OPPORTUNITIES...
DISCOVER LONDINIA OPPORTUNITIES...
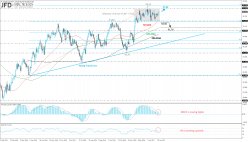
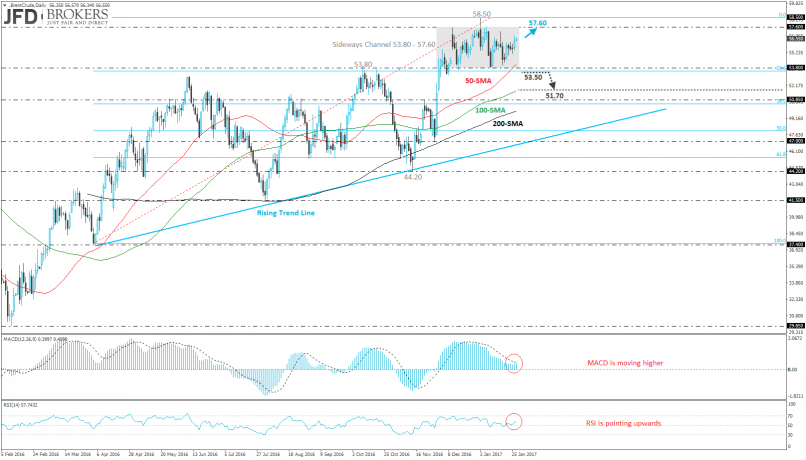
The Brent Crude Oil is establishing within an ascending move since April and it surged almost 40%. The oil price tried to test the rising trendline several times while over the last two months is developing well above it within a sideways channel with upper boundary the $57.60 resistance level and lower boundary the $53.80 support barrier which coincides with the 50-daily SMA.
Currently, the price is moving towards the $57.60 price level or moreover until the previous fresh high at $58.50 resistance barrier. On the other hand, a break below the lower band and the 23.6% Fibonacci retracement level (April 2016 low – January 2017 high) of the last big move will slip the price to 100-daily SMA. The MACD oscillator is moving slightly higher as it is in the process for a bullish crossover its trigger line while the RSI indicator is sloping upwards.
Currently, the price is moving towards the $57.60 price level or moreover until the previous fresh high at $58.50 resistance barrier. On the other hand, a break below the lower band and the 23.6% Fibonacci retracement level (April 2016 low – January 2017 high) of the last big move will slip the price to 100-daily SMA. The MACD oscillator is moving slightly higher as it is in the process for a bullish crossover its trigger line while the RSI indicator is sloping upwards.
This member did not declare if he had a position on this financial instrument or a related financial instrument.
About author

Offline


Add a comment
Comments
0 comments on the analysis BRENT CRUDE OIL - Daily