BRENT CRUDE OIL - Soared at 26-Month High and Hit Our Target at $57.40 - 09/26/2017 (GMT)
- Who voted?
- 613
- 0
- Timeframe : Daily
BRENT CRUDE OIL Chart
Are you looking for opportunities in indices and forex?
DISCOVER LONDINIA OPPORTUNITIES...
DISCOVER LONDINIA OPPORTUNITIES...
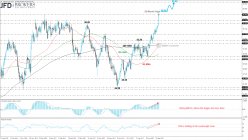
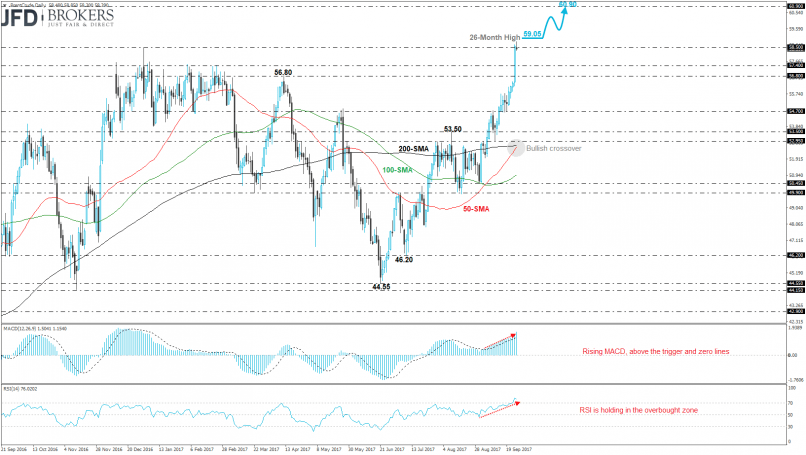
Oil prices extended its gains in yesterday’s trading period and the Brent crude oil soared to a fresh 26-month high and hit the $58.85 price level. The oil had an aggressive buying interest and surged more than 4% in just one period successfully surpassing our suggested target at $57.40 (see previous technical analysis here: http://bit.ly/2xtrFlz). It is worth to mention that the price is recording the third bullish month in a row, adding to its performance more than 11.6%.
Going on the short-term chart, the 50-SMA is ready to post a bullish crossover with the 200-SMA indicating more rising. The MACD oscillator holds above the trigger line and is strengthening, whilst the RSI indicator jumped into the overbought zone and now is sloping slightly to the downside. The next resistance level to have in mind in case of further rise is $60.90.
Going on the short-term chart, the 50-SMA is ready to post a bullish crossover with the 200-SMA indicating more rising. The MACD oscillator holds above the trigger line and is strengthening, whilst the RSI indicator jumped into the overbought zone and now is sloping slightly to the downside. The next resistance level to have in mind in case of further rise is $60.90.
This member declared not having a position on this financial instrument or a related financial instrument.
About author

Offline


Add a comment
Comments
0 comments on the analysis BRENT CRUDE OIL - Daily