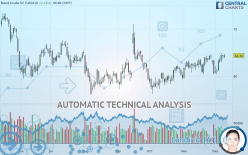
BRENT CRUDE OIL - Daily - Technical analysis published on 12/11/2019 (GMT)
- Who voted?
- 361
- 0
Click here for a new analysis!
- Timeframe : Daily
- - Analysis generated on
- Status : TARGET REACHED

Summary of the analysis

Additional analysis
Quotes
BRENT CRUDE OIL rating 64.34 USD. The price has increased by +0.14% since the last closing and was traded between 63.77 USD and 64.68 USD over the period. The price is currently at +0.89% from its lowest and -0.53% from its highest.The Central Gaps scanner detects a bearish opening. A small advantage for sellers in the very short term.
Bearish opening
Type : Bearish
Timeframe : Openning
Here is a more detailed summary of the historical variations registered by BRENT CRUDE OIL:
Near a new HIGH record (1 month)
Type : Bullish
Timeframe : Weekly
Technical
Technical analysis of this Daily chart of BRENT CRUDE OIL indicates that the overall trend is strongly bullish. The signals given by the moving averages are 85.71% bullish. This strong bullish trend is confirmed by the strong signals currently being given by short-term moving averages. An assessment of moving averages reveals a bullish signal that could impact this trend:
Bullish price crossover with adaptative moving average 100
Type : Bullish
Timeframe : Daily
In fact, 13 technical indicators on 18 studied are currently positioned bullish. But beware of excesses. The Central Indicators scanner currently detects this:
CCI indicator is overbought : over 100
Type : Neutral
Timeframe : Daily
Williams %R indicator is overbought : over -20
Type : Neutral
Timeframe : Daily
Pivot points : price is over resistance 1
Type : Neutral
Timeframe : Weekly
MACD crosses UP its Moving Average
Type : Bullish
Timeframe : Daily
Parabolic SAR indicator bullish reversal
Type : Bullish
Timeframe : Daily
Aroon indicator bullish trend
Type : Bullish
Timeframe : Daily
Ichimoku : price is over the cloud
Type : Bullish
Timeframe : Daily
Price is back over the pivot point
Type : Bullish
Timeframe : Daily
Price is back under the pivot point
Type : Bearish
Timeframe : Weekly
No signals are given by Central Patterns, a market scanner specialised in chart patterns, resistances and supports.
The Central Candlesticks scanner, specialised in Japanese candlesticks, did not identify any signals.
| S3 | S2 | S1 | Price | R1 | R2 | R3 | |
|---|---|---|---|---|---|---|---|
| ProTrendLines | 57.07 | 59.96 | 62.59 | 64.34 | 65.05 | 67.02 | 69.02 |
| Change (%) | -11.30% | -6.81% | -2.72% | - | +1.10% | +4.17% | +7.27% |
| Change | -7.27 | -4.38 | -1.75 | - | +0.71 | +2.68 | +4.68 |
| Level | Major | Intermediate | Major | - | Intermediate | Intermediate | Intermediate |
Attention could also be paid to pivot points to set price objectives:
| Pivot points | S3 | S2 | S1 | PP | R1 | R2 | R3 |
|---|---|---|---|---|---|---|---|
| Standard | 61.16 | 62.00 | 63.19 | 64.03 | 65.22 | 66.06 | 67.25 |
| Camarilla | 63.83 | 64.02 | 64.20 | 64.39 | 64.58 | 64.76 | 64.95 |
| Woodie | 61.35 | 62.09 | 63.38 | 64.12 | 65.41 | 66.15 | 67.44 |
| Fibonacci | 62.00 | 62.77 | 63.25 | 64.03 | 64.80 | 65.28 | 66.06 |
| Pivot points | S3 | S2 | S1 | PP | R1 | R2 | R3 |
|---|---|---|---|---|---|---|---|
| Standard | 54.79 | 57.57 | 59.03 | 61.81 | 63.27 | 66.05 | 67.51 |
| Camarilla | 59.32 | 59.71 | 60.10 | 60.49 | 60.88 | 61.27 | 61.66 |
| Woodie | 54.13 | 57.24 | 58.37 | 61.48 | 62.61 | 65.72 | 66.85 |
| Fibonacci | 57.57 | 59.19 | 60.19 | 61.81 | 63.43 | 64.43 | 66.05 |
| Pivot points | S3 | S2 | S1 | PP | R1 | R2 | R3 |
|---|---|---|---|---|---|---|---|
| Standard | 54.71 | 57.50 | 59.00 | 61.79 | 63.29 | 66.08 | 67.58 |
| Camarilla | 59.31 | 59.70 | 60.10 | 60.49 | 60.88 | 61.28 | 61.67 |
| Woodie | 54.06 | 57.18 | 58.35 | 61.47 | 62.64 | 65.76 | 66.93 |
| Fibonacci | 57.50 | 59.14 | 60.16 | 61.79 | 63.43 | 64.45 | 66.08 |
Numerical data
The following are the details of the technical indicators and moving averages that were collected to generate this technical analysis:
| RSI (14): | 58.22 | |
| MACD (12,26,9): | 0.4800 | |
| Directional Movement: | 5.32 | |
| AROON (14): | 21.43 | |
| DEMA (21): | 63.34 | |
| Parabolic SAR (0,02-0,02-0,2): | 60.39 | |
| Elder Ray (13): | 1.10 | |
| Super Trend (3,10): | 59.66 | |
| Zig ZAG (10): | 64.25 | |
| VORTEX (21): | 1.0800 | |
| Stochastique (14,3,5): | 82.78 | |
| TEMA (21): | 63.46 | |
| Williams %R (14): | -13.38 | |
| Chande Momentum Oscillator (20): | 0.28 | |
| Repulse (5,40,3): | 2.4800 | |
| ROCnROLL: | 1 | |
| TRIX (15,9): | 0.1000 | |
| Courbe Coppock: | 1.73 |
| MA7: | 62.47 | |
| MA20: | 62.78 | |
| MA50: | 61.23 | |
| MA100: | 61.23 | |
| MAexp7: | 63.28 | |
| MAexp20: | 62.72 | |
| MAexp50: | 62.06 | |
| MAexp100: | 62.14 | |
| Price / MA7: | +2.99% | |
| Price / MA20: | +2.48% | |
| Price / MA50: | +5.08% | |
| Price / MA100: | +5.08% | |
| Price / MAexp7: | +1.68% | |
| Price / MAexp20: | +2.58% | |
| Price / MAexp50: | +3.67% | |
| Price / MAexp100: | +3.54% |
News
The last news published on BRENT CRUDE OIL at the time of the generation of this analysis was as follows:
-
 China's 'waiting game' isn't helping it - Brent Wilsey
-
Will Brent crude oil retest the June lows? – 4th July 2019
-
Will Brent Crude push higher? – 11th April 2019
-
Oil news | A trade deal could push Brent to $70
-
Short Brent crude | Trade of the week
About author

Online


Add a comment
Comments
0 comments on the analysis BRENT CRUDE OIL - Daily