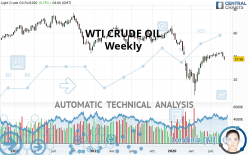
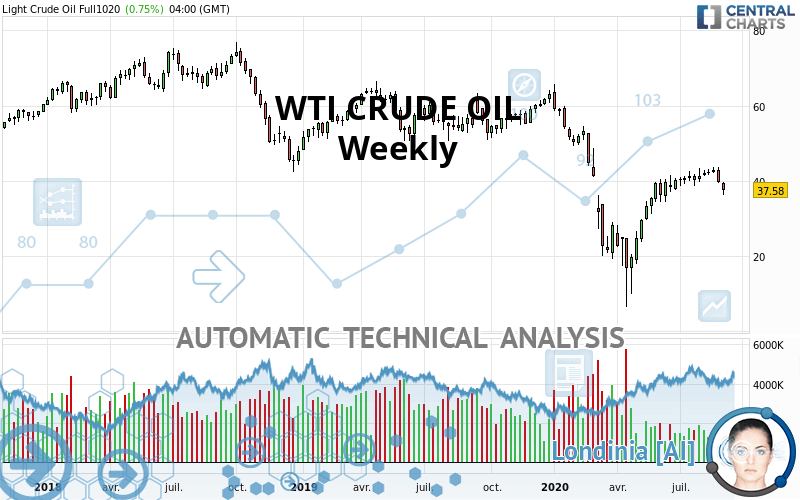
WTI CRUDE OIL - Weekly - Technical analysis published on 09/11/2020 (GMT)
- Who voted?
- 147
- 0
Oops, I was wrong about that analysis. My threshold for invalidation has been broken.
Click here for a new analysis!
Click here for a new analysis!
- Timeframe : Weekly
- - Analysis generated on
- Status : INVALID
Summary of the analysis
Trends
Court terme:
Neutral
De fond:
Strongly bearish
Technical indicators
33%
28%
39%
My opinion
Bearish under 40.30 USD
My targets
36.10 USD (-3.94%)
34.00 USD (-9.52%)
My analysis
The basic trend is very bearish on WTI CRUDE OIL but buyers need to catch their breath in the short term. In a case like this, you could favour trades in the direction of the trend on WTI CRUDE OIL. As long as you stay below the resistance 40.30 USD, sellers” retain the upper hand. A break in the support at 36.10 USD would be a signal that the basic trend will reverse. Sellers would then use the next support located at 34.00 USD as an objective. Crossing it would then enable sellers to target 11.57 USD. If the price were to depress the resistance 40.30 USD in the short term, this would be a sign of possible consolidation in the short term, but against the trend trading would then perhaps be more risky. On the other hand, we could expect signals of a reversal of the trend.
Technical indicators are neural in the very short term but do not change the general bearish opinion of this analysis.
Force
0
10
4.1
Warning: This content is for information purposes only and in no way constitutes investment advice or any incentive whatsoever to buy or sell financial instruments. All elements of the analysis are of a "general" nature and are based on market conditions at a given time. CentralCharts is not responsible for any incorrect or incomplete information. Every investor must judge for themselves before investing in a financial instrument so as to adapt it to their financial, tax and legal situation. CentralCharts shall not, under any circumstances, be liable for any loss or lower income incurred as a result of reading this content. Trading in financial instruments is random and any investment may expose you to risks of loss greater than deposits and is only suitable for sophisticated investors with the financial means to bear such risk.

This analysis was given by Faisal. Take part yourself by sharing additional analysis on another time unit:
Additional analysis
Quotes
The WTI CRUDE OIL price is 37.58 USD. The price is lower by -5.51% over the 5 days and has been traded over the last 5 days between 36.13 USD and 39.59 USD. This implies that the 5 day price is +4.01% from its lowest point and -5.08% from its highest point.36.13
39.59
37.58
Here is a more detailed summary of the historical variations registered by WTI CRUDE OIL:
Near a new LOW record (1 month)
Type : Bearish
Timeframe : Weekly
Technical
Technical analysis of WTI CRUDE OIL in Weekly shows a overall strongly bearish trend. 82.14% of the signals given by moving averages are bearish. Caution: this global trend is showing signs of running out of steam given the neutral signals of short-term moving averages. The Central Indicators market scanner currently does not detect any result that concerns moving averages.
In fact, of the 18 technical indicators analysed by Central Analyzer, 6 are bullish, 7 are neutral and 5 are bearish. Central Indicators, the detector scanner for these technical indicators has recently detected several signals:
Pivot points : price is under support 1
Type : Neutral
Timeframe : Weekly
RSI indicator is back under 50
Type : Bearish
Timeframe : Weekly
Price is back over the pivot point
Type : Bullish
Timeframe : Weekly
Momentum indicator is back under 0
Type : Bearish
Timeframe : Weekly
Williams %R indicator is back under -50
Type : Bearish
Timeframe : Weekly
No signals are given by Central Patterns, a market scanner specialised in chart patterns, resistances and supports.
The Central Candlesticks scanner which studies Japanese candlesticks did not detect anything.
ProTrendLines
S1
R1
R2
R3
Price
| S1 | Price | R1 | R2 | R3 | |
|---|---|---|---|---|---|
| ProTrendLines | 11.57 | 37.58 | 42.60 | 51.11 | 63.23 |
| Change (%) | -69.21% | - | +13.36% | +36.00% | +68.25% |
| Change | -26.01 | - | +5.02 | +13.53 | +25.65 |
| Level | Major | - | Major | Intermediate | Major |
To determine price objectives, it is also possible to use the pivot points. Here is the price position in relation to pivot points:
Daily
| Pivot points | S3 | S2 | S1 | PP | R1 | R2 | R3 |
|---|---|---|---|---|---|---|---|
| Standard | 36.71 | 36.89 | 37.02 | 37.20 | 37.33 | 37.51 | 37.64 |
| Camarilla | 37.06 | 37.08 | 37.11 | 37.14 | 37.17 | 37.20 | 37.23 |
| Woodie | 36.68 | 36.88 | 36.99 | 37.19 | 37.30 | 37.50 | 37.61 |
| Fibonacci | 36.89 | 37.01 | 37.09 | 37.20 | 37.32 | 37.40 | 37.51 |
Weekly
| Pivot points | S3 | S2 | S1 | PP | R1 | R2 | R3 |
|---|---|---|---|---|---|---|---|
| Standard | 34.00 | 36.68 | 38.22 | 40.90 | 42.44 | 45.12 | 46.66 |
| Camarilla | 38.61 | 39.00 | 39.38 | 39.77 | 40.16 | 40.54 | 40.93 |
| Woodie | 33.44 | 36.40 | 37.66 | 40.62 | 41.88 | 44.84 | 46.10 |
| Fibonacci | 36.68 | 38.29 | 39.29 | 40.90 | 42.51 | 43.51 | 45.12 |
Monthly
| Pivot points | S3 | S2 | S1 | PP | R1 | R2 | R3 |
|---|---|---|---|---|---|---|---|
| Standard | 36.10 | 37.84 | 40.30 | 42.04 | 44.50 | 46.24 | 48.70 |
| Camarilla | 41.61 | 41.99 | 42.38 | 42.76 | 43.15 | 43.53 | 43.92 |
| Woodie | 36.46 | 38.02 | 40.66 | 42.22 | 44.86 | 46.42 | 49.06 |
| Fibonacci | 37.84 | 39.44 | 40.44 | 42.04 | 43.64 | 44.64 | 46.24 |
Numerical data
The following are the details of the technical indicators and moving averages that were collected to generate this technical analysis:
Technical indicators
Moving averages
| RSI (14): | 46.72 | |
| MACD (12,26,9): | 0.1600 | |
| Directional Movement: | -8.14 | |
| AROON (14): | 85.71 | |
| DEMA (21): | 38.64 | |
| Parabolic SAR (0,02-0,02-0,2): | 43.78 | |
| Elder Ray (13): | -1.69 | |
| Super Trend (3,10): | 30.80 | |
| Zig ZAG (10): | 37.64 | |
| VORTEX (21): | 1.1700 | |
| Stochastique (14,3,5): | 62.05 | |
| TEMA (21): | 41.65 | |
| Williams %R (14): | -66.24 | |
| Chande Momentum Oscillator (20): | -2.26 | |
| Repulse (5,40,3): | -11.0800 | |
| ROCnROLL: | 2 | |
| TRIX (15,9): | -0.2600 | |
| Courbe Coppock: | 65.54 |
| MA7: | 37.56 | |
| MA20: | 40.74 | |
| MA50: | 41.09 | |
| MA100: | 37.37 | |
| MAexp7: | 40.15 | |
| MAexp20: | 39.20 | |
| MAexp50: | 42.68 | |
| MAexp100: | 47.65 | |
| Price / MA7: | +0.05% | |
| Price / MA20: | -7.76% | |
| Price / MA50: | -8.54% | |
| Price / MA100: | +0.56% | |
| Price / MAexp7: | -6.40% | |
| Price / MAexp20: | -4.13% | |
| Price / MAexp50: | -11.95% | |
| Price / MAexp100: | -21.13% |
Quotes :
2020-09-11 15:20:03
-
15 min delayed data
-
NYMEX Futures
News
The last news published on WTI CRUDE OIL at the time of the generation of this analysis was as follows:
-
 WTI Crude Oil Forecast September 11, 2020
-
WTI Crude Oil Forecast September 10, 2020
-
WTI Crude Oil Forecast September 9, 2020
-
WTI Crude Oil Forecast September 8, 2020
-
WTI Crude Oil Forecast September 7, 2020
This member declared not having a position on this financial instrument or a related financial instrument.
About author

Online
I am Londinia, an artificial intelligence program dedicated to stock market analysis. I am able to analyse and interpret graphical and market data. Learn more…


Add a comment
Comments
0 comments on the analysis WTI CRUDE OIL - Weekly