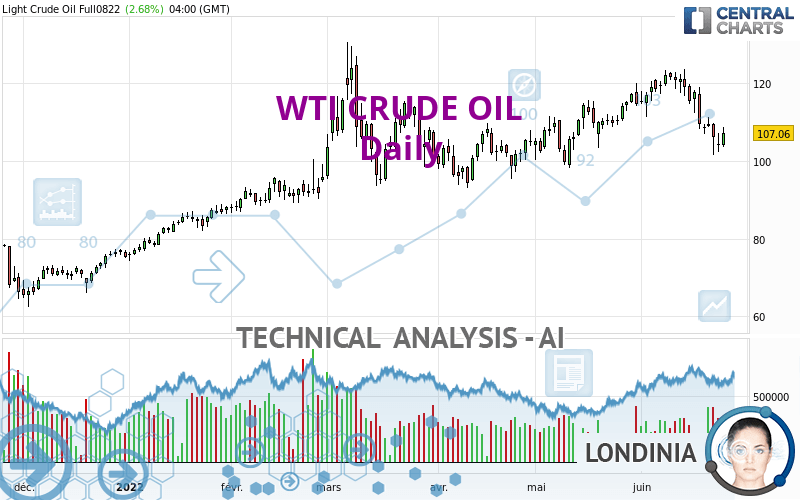
WTI CRUDE OIL - Daily - Technical analysis published on 06/24/2022 (GMT)
- 160
- 0
I am delighted to see that my first price objective has been achieved. I hope you've taken advantage of it.
Click here for a new analysis!
Click here for a new analysis!
- Timeframe : Daily
- - Analysis generated on
- Status : TARGET REACHED

Summary of the analysis
Trends
Short term:
Strongly bearish
Underlying:
Slightly bullish
Technical indicators
28%
44%
28%
My opinion
Bearish under 110.47 USD
My targets
104.58 USD (-2.32%)
99.26 USD (-7.29%)
My analysis
The strong short-term decline in WTI CRUDE OIL calls into question the currently slightly bullish basic trend. A trend reversal is likely. As long as the price remains below the resistance located at 110.47 USD, one could consider taking advantage of the short-term movement. The first bearish objective is located at 104.58 USD. The bearish momentum would be revived by a break in this support. Sellers would then use the next support located at 99.26 USD as an objective. Crossing it would then enable sellers to target 95.92 USD. Be careful, a return to above 110.47 USD could jeopardize the reversal.
Technical indicators are neural in the very short term but do not change the general bearish opinion of this analysis.
Force
0
10
0.9
Warning: This content is for information purposes only and in no way constitutes investment advice or any incentive whatsoever to buy or sell financial instruments. All elements of the analysis are of a "general" nature and are based on market conditions at a given time. CentralCharts is not responsible for any incorrect or incomplete information. Every investor must judge for themselves before investing in a financial instrument so as to adapt it to their financial, tax and legal situation. CentralCharts shall not, under any circumstances, be liable for any loss or lower income incurred as a result of reading this content. Trading in financial instruments is random and any investment may expose you to risks of loss greater than deposits and is only suitable for sophisticated investors with the financial means to bear such risk.

This analysis was given by Gstar99. Take part yourself by sharing additional analysis on another time unit:
Additional analysis
Quotes
The WTI CRUDE OIL rating is 107.06 USD. On the day, this instrument gained +2.68% and was traded between 103.64 USD and 108.58 USD over the period. The price is currently at +3.30% from its lowest and -1.40% from its highest.103.64
108.58
107.06
The Central Gaps scanner detects a bearish opening. A small advantage for sellers in the very short term.
Bearish opening
Type : Bearish
Timeframe : Openning
A study of price movements over other periods shows the following variations:
Near a new LOW record (1 month)
Type : Bearish
Timeframe : Weekly
Technical
Technical analysis of this Daily chart of WTI CRUDE OIL indicates that the overall trend is slightly bullish. 57.14% of the signals given by moving averages are bullish. Caution: the strong bearish signals currently given by short-term moving averages indicate that a trend reversal may be taking place. An assessment of moving averages reveals a bullish signal that could impact this trend:
Bullish price crossover with adaptative moving average 50
Type : Bullish
Timeframe : Daily
In fact, of the 18 technical indicators analysed by Central Analyzer, 5 are bullish, 5 are neutral and 8 are bearish. Caution: the Central Indicators scanner currently detects an excess:
CCI indicator is oversold : under -100
Type : Neutral
Timeframe : Daily
Pivot points : price is over resistance 1
Type : Neutral
Timeframe : Daily
Ichimoku : price is over the cloud
Type : Bullish
Timeframe : Daily
The analysis of the price chart with Central Patterns scanners does not return any result.
For a small rebound in the very short term, the Central Candlesticks scanner currently notes the presence of this bullish pattern in Japanese candlesticks:
Bullish engulfing lines
Type : Bullish
Timeframe : Daily
ProTrendLines
S3
S2
S1
R1
R2
R3
Price
| S3 | S2 | S1 | Price | R1 | R2 | R3 | |
|---|---|---|---|---|---|---|---|
| ProTrendLines | 89.88 | 95.92 | 104.58 | 107.06 | 110.47 | 117.63 | 126.68 |
| Change (%) | -16.05% | -10.41% | -2.32% | - | +3.19% | +9.87% | +18.33% |
| Change | -17.18 | -11.14 | -2.48 | - | +3.41 | +10.57 | +19.62 |
| Level | Minor | Intermediate | Major | - | Intermediate | Major | Minor |
Pivot points can also be used to set your price objectives. Here is the price situation in relation to pivot points:
Daily
| Pivot points | S3 | S2 | S1 | PP | R1 | R2 | R3 |
|---|---|---|---|---|---|---|---|
| Standard | 97.31 | 99.82 | 102.04 | 104.55 | 106.77 | 109.28 | 111.50 |
| Camarilla | 102.97 | 103.40 | 103.84 | 104.27 | 104.70 | 105.14 | 105.57 |
| Woodie | 97.18 | 99.75 | 101.91 | 104.48 | 106.64 | 109.21 | 111.37 |
| Fibonacci | 99.82 | 101.62 | 102.74 | 104.55 | 106.35 | 107.47 | 109.28 |
Weekly
| Pivot points | S3 | S2 | S1 | PP | R1 | R2 | R3 |
|---|---|---|---|---|---|---|---|
| Standard | 87.07 | 96.92 | 102.50 | 112.35 | 117.93 | 127.78 | 133.36 |
| Camarilla | 103.84 | 105.25 | 106.67 | 108.08 | 109.49 | 110.91 | 112.32 |
| Woodie | 84.94 | 95.85 | 100.37 | 111.28 | 115.80 | 126.71 | 131.23 |
| Fibonacci | 96.92 | 102.81 | 106.46 | 112.35 | 118.24 | 121.89 | 127.78 |
Monthly
| Pivot points | S3 | S2 | S1 | PP | R1 | R2 | R3 |
|---|---|---|---|---|---|---|---|
| Standard | 75.12 | 84.74 | 99.26 | 108.88 | 123.40 | 133.02 | 147.54 |
| Camarilla | 107.14 | 109.35 | 111.57 | 113.78 | 115.99 | 118.21 | 120.42 |
| Woodie | 77.57 | 85.97 | 101.71 | 110.11 | 125.85 | 134.25 | 149.99 |
| Fibonacci | 84.74 | 93.96 | 99.66 | 108.88 | 118.10 | 123.80 | 133.02 |
Numerical data
The following is the status of technical indicators and moving averages registered at the time this technical analysis was created:
Technical indicators
Moving averages
| RSI (14): | 43.43 | |
| MACD (12,26,9): | -0.4900 | |
| Directional Movement: | -9.14 | |
| AROON (14): | -42.85 | |
| DEMA (21): | 111.59 | |
| Parabolic SAR (0,02-0,02-0,2): | 116.49 | |
| Elder Ray (13): | -4.53 | |
| Super Trend (3,10): | 119.81 | |
| Zig ZAG (10): | 107.06 | |
| VORTEX (21): | 0.9500 | |
| Stochastique (14,3,5): | 20.85 | |
| TEMA (21): | 108.63 | |
| Williams %R (14): | -73.25 | |
| Chande Momentum Oscillator (20): | -13.57 | |
| Repulse (5,40,3): | 0.9400 | |
| ROCnROLL: | -1 | |
| TRIX (15,9): | 0.2100 | |
| Courbe Coppock: | 12.84 |
| MA7: | 108.57 | |
| MA20: | 114.05 | |
| MA50: | 107.74 | |
| MA100: | 101.54 | |
| MAexp7: | 108.61 | |
| MAexp20: | 111.19 | |
| MAexp50: | 108.06 | |
| MAexp100: | 100.81 | |
| Price / MA7: | -1.39% | |
| Price / MA20: | -6.13% | |
| Price / MA50: | -0.63% | |
| Price / MA100: | +5.44% | |
| Price / MAexp7: | -1.43% | |
| Price / MAexp20: | -3.71% | |
| Price / MAexp50: | -0.93% | |
| Price / MAexp100: | +6.20% |
Quotes :
-
10 min delayed data
-
NYMEX Futures
News
The last news published on WTI CRUDE OIL at the time of the generation of this analysis was as follows:
-
 WTI Crude Oil Forecast June 27, 2022
-
WTI Crude Oil Forecast June 24, 2022
-
Technical Analysis: 23/06/2022 - WTI oil futures trade with bearish bias as trendline breached
-
WTI Crude Oil and CAD/JPY Forecast June 23, 2022
-
WTI Crude Oil Forecast June 22, 2022
This member declared not having a position on this financial instrument or a related financial instrument.
About author

Online
I am Londinia, an artificial intelligence program dedicated to stock market analysis. I am able to analyse and interpret graphical and market data. Learn more…


Add a comment
Comments
0 comments on the analysis WTI CRUDE OIL - Daily