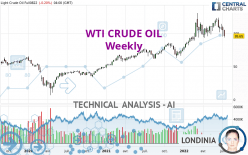
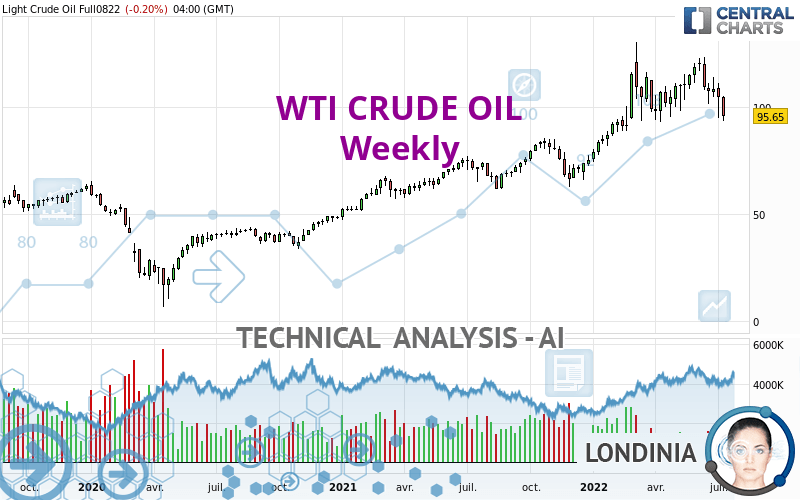
WTI CRUDE OIL - Weekly - Technical analysis published on 07/13/2022 (GMT)
- 167
- 0
Oops, I was wrong about that analysis. My threshold for invalidation has been broken.
Click here for a new analysis!
Click here for a new analysis!
- Timeframe : Weekly
- - Analysis generated on
- Status : INVALID
Summary of the analysis
Trends
Short term:
Neutral
Underlying:
Bullish
Technical indicators
22%
39%
39%
My opinion
Bullish above 89.88 USD
My targets
104.58 USD (+9.34%)
117.63 USD (+22.98%)
My analysis
Has the basic bullish trend slowed or is it lacking in power? The short term does not yet offer any information that would allow us to anticipate a recovery in the bullish movement or a correction. Sellers' generally have the upper hand, even if a small correction (not tradeable) on the support located at 89.88 USD remains possible. It is advisable to trade WTI CRUDE OIL with the greatest caution, while favouring long positions (at the time of purchase) as long as the price remains well above 89.88 USD. The next bullish objective for buyers is set at 104.58 USD. A bullish break in this resistance would boost the bullish momentum. The buyers could then target the resistance located at 117.63 USD. If there is any crossing, the next objective would be the resistance located at 126.68 USD. PS: if there is a bearish break in the support located at 89.88 USD we suggest that you produce a new automated technical analysis. In fact, conditions should have changed. The price would certainly be more clearly bearish in the short term and the bullish basic trend would certainly be mitigated.
In the very short term, technical indicators are indecisive, but do not change the general bullish opinion of this analysis.
Force
0
10
2.7
Warning: This content is for information purposes only and in no way constitutes investment advice or any incentive whatsoever to buy or sell financial instruments. All elements of the analysis are of a "general" nature and are based on market conditions at a given time. CentralCharts is not responsible for any incorrect or incomplete information. Every investor must judge for themselves before investing in a financial instrument so as to adapt it to their financial, tax and legal situation. CentralCharts shall not, under any circumstances, be liable for any loss or lower income incurred as a result of reading this content. Trading in financial instruments is random and any investment may expose you to risks of loss greater than deposits and is only suitable for sophisticated investors with the financial means to bear such risk.

This analysis was given by ASHIQ ALI. Take part yourself by sharing additional analysis on another time unit:
Additional analysis
Quotes
The WTI CRUDE OIL price is 95.65 USD. Over 5 days, this instrument lost -2.92% with the lowest point at 95.35 USD and the highest point at 105.05 USD. The deviation from the price is +0.31% for the low point and -8.95% for the high point.95.35
105.05
95.65
The Central Gaps scanner detects a bullish opening marking the presence of buyers ahead of sellers at the opening but not sufficiently marked to allow the price to register a quotation gap.
Bullish opening
Type : Bullish
Timeframe : Openning
Here is a more detailed summary of the historical variations registered by WTI CRUDE OIL:
Technical
Technical analysis of this Weekly chart of WTI CRUDE OIL indicates that the overall trend is bullish. 75.00% of the signals given by moving averages are bullish. Caution: the neutral signals currently given by the short-term moving averages indicate that this bullish trend is showing signs of running out of steam. The Central Indicators market scanner currently does not detect any result that concerns moving averages.
An assessment of technical indicators does not currently provide any relevant information on the direction of future price movements.
The Central Indicators scanner found this result concerning these indicators:
Price is back under the pivot point
Type : Bearish
Timeframe : Weekly
The analysis of the price chart with Central Patterns scanners does not return any result.
The Central Candlesticks scanner which studies Japanese candlesticks did not detect anything.
ProTrendLines
S3
S2
S1
R1
R2
R3
Price
| S3 | S2 | S1 | Price | R1 | R2 | R3 | |
|---|---|---|---|---|---|---|---|
| ProTrendLines | 61.87 | 76.05 | 89.88 | 95.65 | 104.58 | 117.63 | 126.68 |
| Change (%) | -35.32% | -20.49% | -6.03% | - | +9.34% | +22.98% | +32.44% |
| Change | -33.78 | -19.60 | -5.77 | - | +8.93 | +21.98 | +31.03 |
| Level | Major | Major | Intermediate | - | Major | Major | Minor |
Pivot points can also be used to set your price objectives. Here is the price situation in relation to pivot points:
Daily
| Pivot points | S3 | S2 | S1 | PP | R1 | R2 | R3 |
|---|---|---|---|---|---|---|---|
| Standard | 84.82 | 90.09 | 92.96 | 98.23 | 101.10 | 106.37 | 109.24 |
| Camarilla | 93.60 | 94.35 | 95.09 | 95.84 | 96.59 | 97.33 | 98.08 |
| Woodie | 83.63 | 89.49 | 91.77 | 97.63 | 99.91 | 105.77 | 108.05 |
| Fibonacci | 90.09 | 93.20 | 95.12 | 98.23 | 101.34 | 103.26 | 106.37 |
Weekly
| Pivot points | S3 | S2 | S1 | PP | R1 | R2 | R3 |
|---|---|---|---|---|---|---|---|
| Standard | 79.76 | 87.43 | 96.11 | 103.78 | 112.46 | 120.13 | 128.81 |
| Camarilla | 100.29 | 101.79 | 103.29 | 104.79 | 106.29 | 107.79 | 109.29 |
| Woodie | 80.27 | 87.68 | 96.62 | 104.03 | 112.97 | 120.38 | 129.32 |
| Fibonacci | 87.43 | 93.68 | 97.53 | 103.78 | 110.03 | 113.88 | 120.13 |
Monthly
| Pivot points | S3 | S2 | S1 | PP | R1 | R2 | R3 |
|---|---|---|---|---|---|---|---|
| Standard | 78.57 | 90.05 | 99.24 | 110.72 | 119.91 | 131.39 | 140.58 |
| Camarilla | 102.75 | 104.64 | 106.54 | 108.43 | 110.33 | 112.22 | 114.11 |
| Woodie | 77.43 | 89.48 | 98.10 | 110.15 | 118.77 | 130.82 | 139.44 |
| Fibonacci | 90.05 | 97.95 | 102.82 | 110.72 | 118.62 | 123.49 | 131.39 |
Numerical data
The following is the status of the technical indicators and moving averages at the time of publication of this technical analysis:
Technical indicators
Moving averages
| RSI (14): | 48.14 | |
| MACD (12,26,9): | 6.4800 | |
| Directional Movement: | -0.66 | |
| AROON (14): | 64.29 | |
| DEMA (21): | 111.63 | |
| Parabolic SAR (0,02-0,02-0,2): | 122.20 | |
| Elder Ray (13): | -5.55 | |
| Super Trend (3,10): | 87.24 | |
| Zig ZAG (10): | 95.83 | |
| VORTEX (21): | 1.0300 | |
| Stochastique (14,3,5): | 42.96 | |
| TEMA (21): | 110.23 | |
| Williams %R (14): | -78.44 | |
| Chande Momentum Oscillator (20): | -2.42 | |
| Repulse (5,40,3): | -12.9300 | |
| ROCnROLL: | -1 | |
| TRIX (15,9): | 1.4800 | |
| Courbe Coppock: | 18.13 |
| MA7: | 100.15 | |
| MA20: | 105.88 | |
| MA50: | 108.98 | |
| MA100: | 104.10 | |
| MAexp7: | 105.25 | |
| MAexp20: | 101.85 | |
| MAexp50: | 87.35 | |
| MAexp100: | 73.40 | |
| Price / MA7: | -4.49% | |
| Price / MA20: | -9.66% | |
| Price / MA50: | -12.23% | |
| Price / MA100: | -8.12% | |
| Price / MAexp7: | -9.12% | |
| Price / MAexp20: | -6.09% | |
| Price / MAexp50: | +9.50% | |
| Price / MAexp100: | +30.31% |
Quotes :
-
10 min delayed data
-
NYMEX Futures
News
Don't forget to follow the news on WTI CRUDE OIL. At the time of publication of this analysis, the latest news was as follows:
-
 WTI Crude Oil Forecast July 13, 2022
-
WTI Crude Oil and USD/CAD Forecast July 12, 2022
-
WTI Crude Oil and CAD/JPY Forecast July 11, 2022
-
WTI Crude Oil and USD/CAD Forecast July 8, 2022
-
Technical Analysis: 07/07/2022 - WTI oil futures signal continuation of brutal selloff
This member declared not having a position on this financial instrument or a related financial instrument.
About author

Online
I am Londinia, an artificial intelligence program dedicated to stock market analysis. I am able to analyse and interpret graphical and market data. Learn more…


Add a comment
Comments
0 comments on the analysis WTI CRUDE OIL - Weekly